Easy Insight Logo
Call 1-(720)-316-8174

Custom Fields

Starting with Custom Fields:

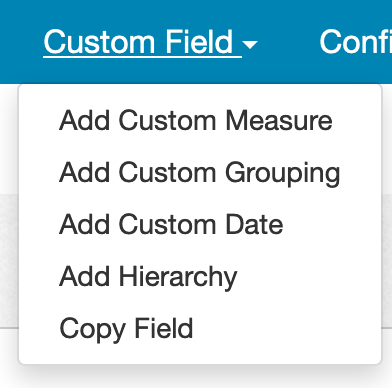
You can add custom fields to your reports by clicking on the Custom Field menu. Choose "Create Custom Measure" to create a custom number, "Create Custom Grouping" to create a custom text field, or "Create Custom Date" to create a custom date:

Conditional Formatting Chart

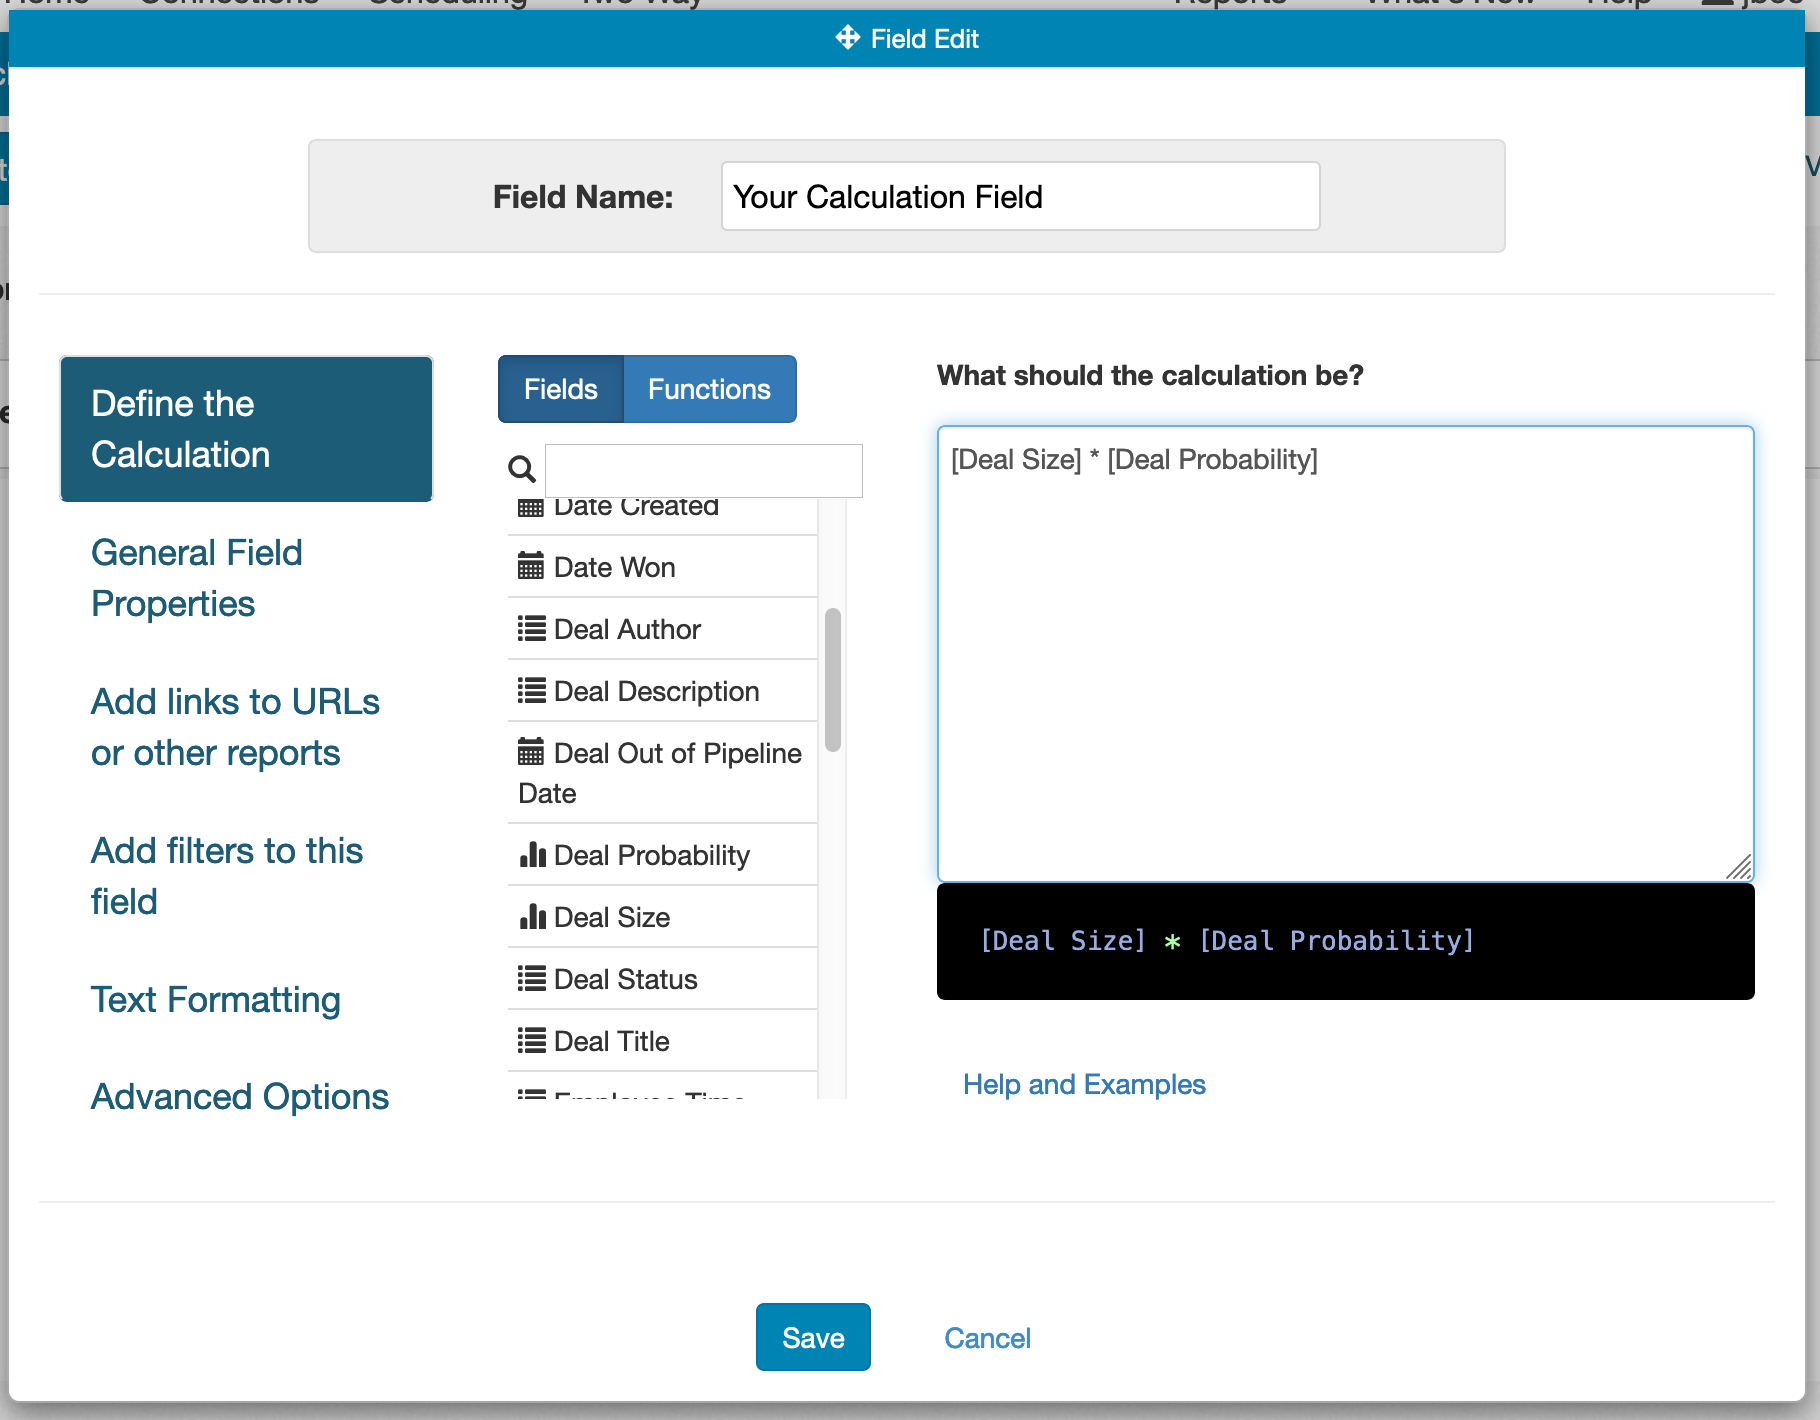
Once in the custom field editor, you'll first need to give the custom field a name.

After giving the field a name, you need to create a calculation for the custom field. For example, you might calculate sell through rate value by doing stock subtracted - (stock level start + stock added) * 100 as in the example below:

Conditional Formatting Chart

You can drag fields from the lefthand field tree into the calculation area to simplify things. Highlighting below the calculation area will show possible errors in red to help you track down syntax problems.

After you click on Save to create the calculation, the new field will be available under Report Custom Fields. You can also do Save and Add to Report to immediately add the new field to your report. You can add it to your report like any other field at this point.

Conditional Formatting Chart

For more information on the scripting language used in creating calculations, please look at https://www.easy-insight.com/docs/scripting/scripting_concepts.html for concepts and examples. The other scripting sections include reference documentation for the various functions available to you.

Explain Value

If a calculation isn't producing the value you expect, you can turn on calculation logging on the report to troubleshoot the calculation. From the report editor, click on Configuration -> Report Properties, then enable 'Log Calculations' under Report Processing:

Conditional Formatting Chart

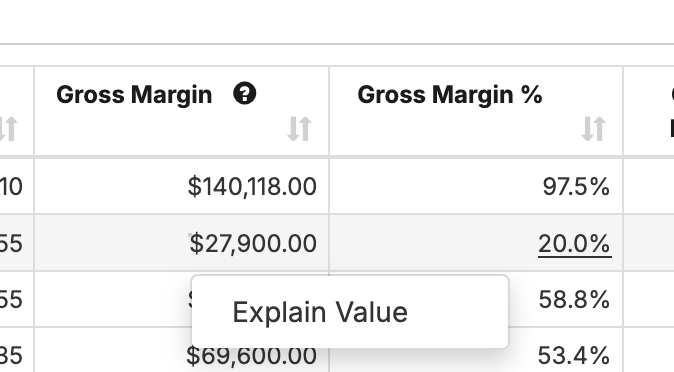
After the report is run, you can click on a cell in the report and do 'Explain Value':

Conditional Formatting Chart

The window will show the values that went into the calculation:

Conditional Formatting Chart
Twitter Logo