Easy Insight Logo

Easy Insight Features and Functionality

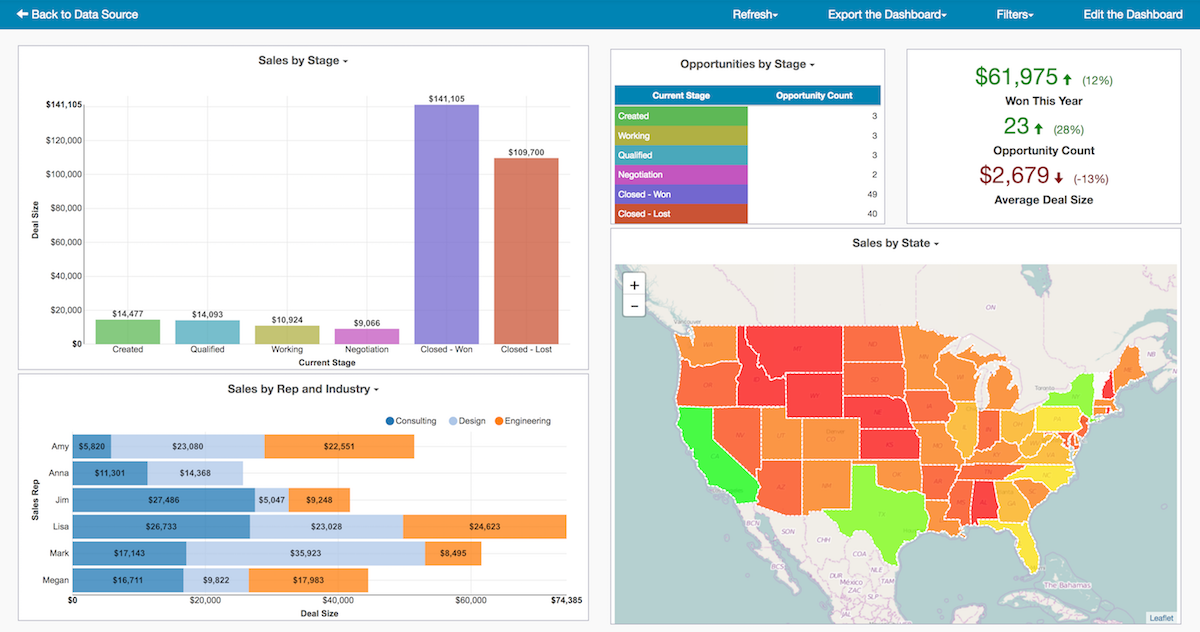
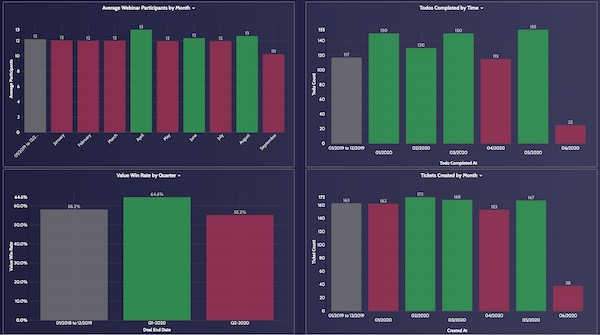
Quarter over Quarter Dashboard

Click and connect to a variety of systems

Need better reports and dashboards on your SaaS data? Easy Insight offers instant connections to dozens of systems with a robust library of prebuilt dashboard templates. To see the different connections we offer, take a look at our Data Connections page.


Create your own data sources

Build custom data sources and add or edit values right through your reports. Simply click on a table cell and start editing to update the value. Is your SaaS system missing a field you'd like? Link your user sources with your SaaS data add your own custom fields.

Quarter over Quarter Dashboard

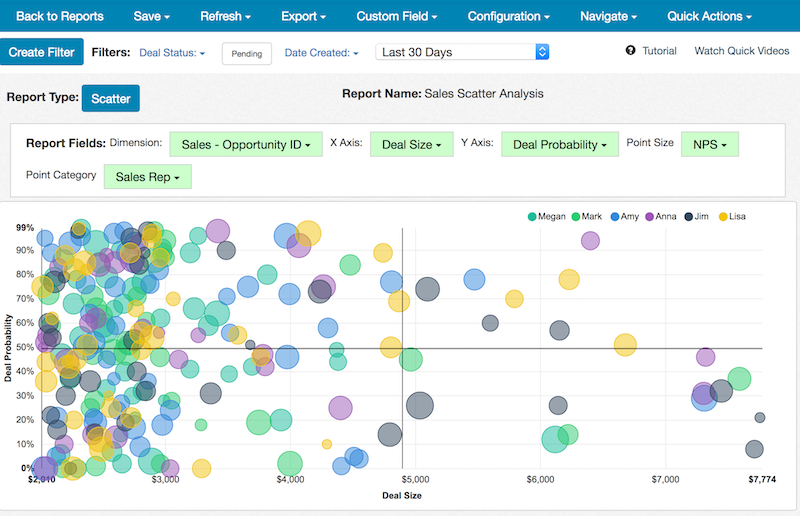
Report Editor Sample

Easy report creation

Easy Insight’s report builder enables you to quickly and intuitively build a wide variety of reports in a matter of clicks. Click here to read more about building custom reports and dashboards in Easy Insight.


Combine your data

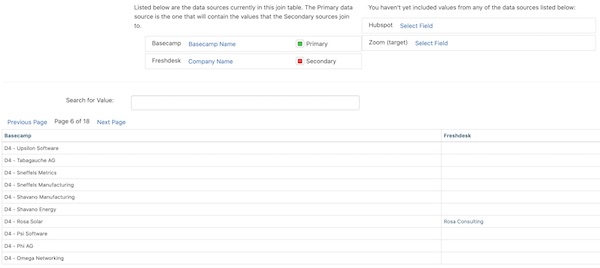
Combine different data sources to enable reporting across your entire business. Add reports from different systems together into a single dashboard or join the underlying data sources together to create reports on unified data. Click here to read more about how you can combine your data in Easy Insight.

Combined Dashboard

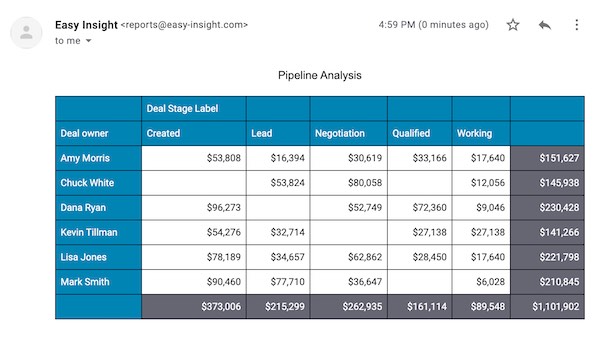
Report Email Example

Email your reports and dashboards

Set up recurring exports of your reports and dashboards by email. Send as inline HTML emails, PDFs, Excel sheets, and PNGs. You can even post to a Slack channel!


Data level security

Have 500 users who should each see only their own data? Set up per user data restrictions to automatically apply permissions when users access reports and only show the appropriate subset of information, without requiring you to create copies of reports per user. Read more about data level security in Easy Insight.


Embedded analytics

Embed and customize your Easy Insight dashboards into your own site. Configure the dashboard look and feel to match your own and ensure a seamless user experience. Read more about embedded dashboards.


Field Scripting

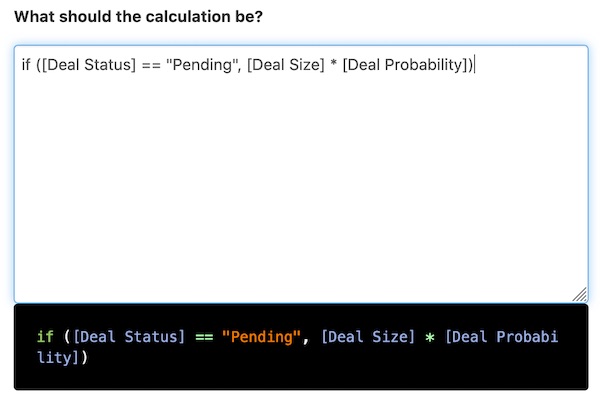
Create custom fields using Easy Insight's scripting language. You can perform math, transform text, and adjust dates. You can even calculate quantiles and standard deviation, parse out JSON, and look for the last value based on a certain date.

You can also apply scripting with conditional formatting to change the look and feel of a report through scripting. Color certain cells on a table, apply a color to a certain chart bar, and more!

Custom Field Scripting Example

Join Table Example

Transform Data within Easy Insight

Easy Insight contains extensive capabilities around transforming the data so that you can get the accurate reports you need out of data that may need some amount of cleaning. Create reports that apply a variety of logic to the data, then transform those reports directly into data sources themselves.


Two Way Connections

For some connections, Easy Insight enables you to update data directly back in the source system. Tired of trying to make changes across multiple projects when you have to jump in and out of each project? Quickly change assignees or due dates from a holistic view across your entire project management system.

Two way connections also provide a way to help clean your data. You can use reports to quickly identify bad data, then use the two way connection to delete or fix the bad data.

Two Way Custom Field Example

Two Way Integration Example

Two Way Integrations

The same two way functionality can also copy data from one system to another. Convert tickets into project management tasks or deals into projects. Merge data from multiple sources into one row of data, then copy that single row into the target system. You can also set up recurring integrations off of reports to run on a scheduled basis.


Process Dashboards

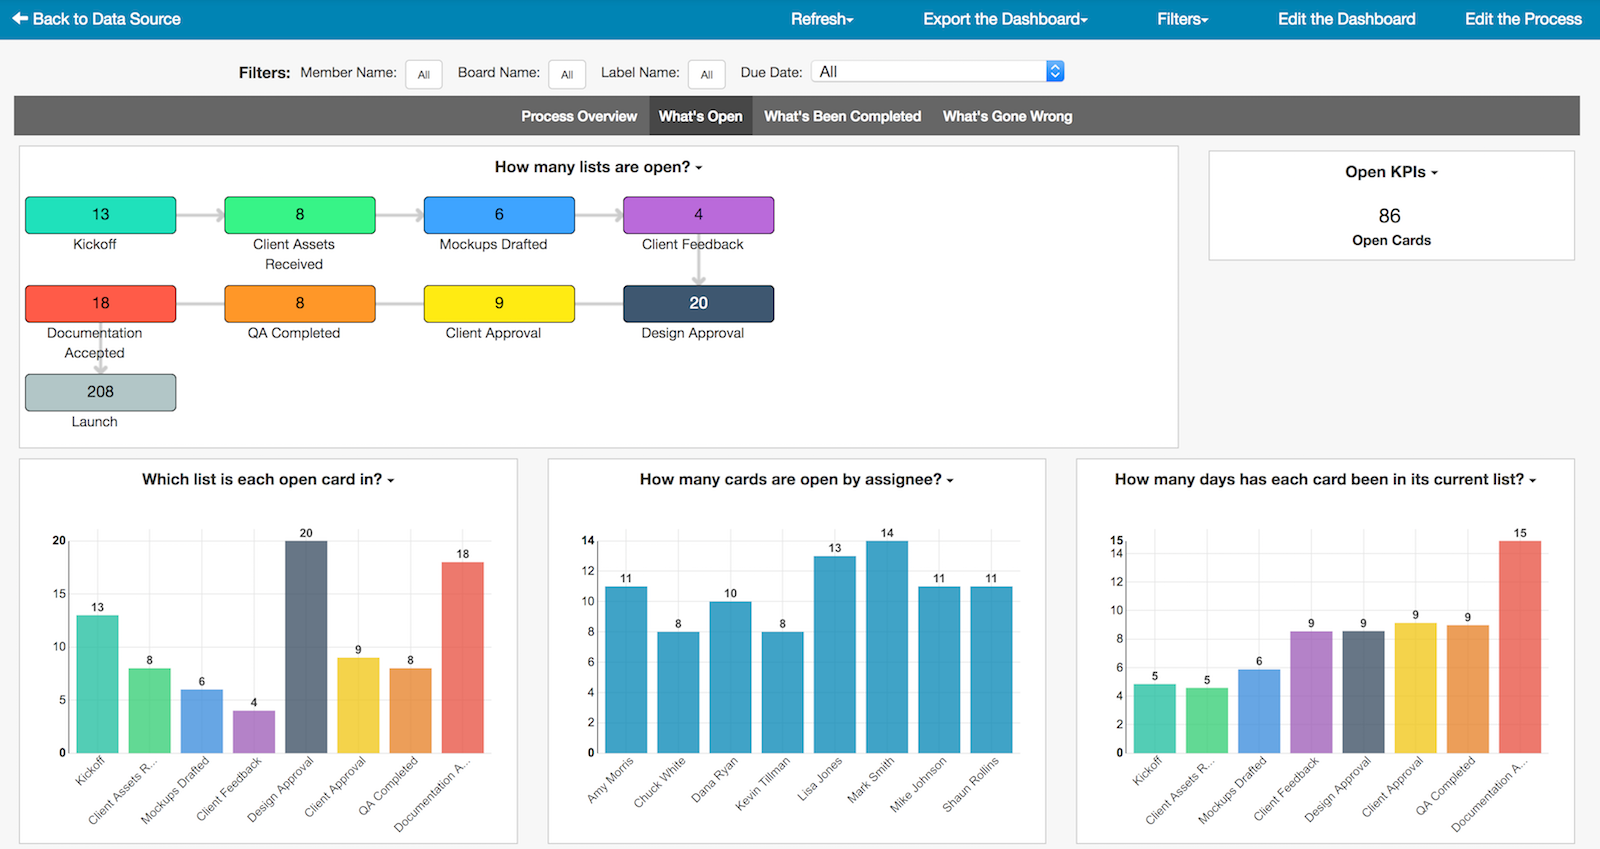
Are you a creative agency, tracking design work from requirements to delivery? Are you tracking orders from request to cash? Take advantage of Easy Insight's process functionality to look at how quickly work is going from step to step, how many orders are currently in each step, and how often work is repeatedly going through the same step, all in a couple of clicks.

Process Dashboard
RESOURCES
Twitter Logo