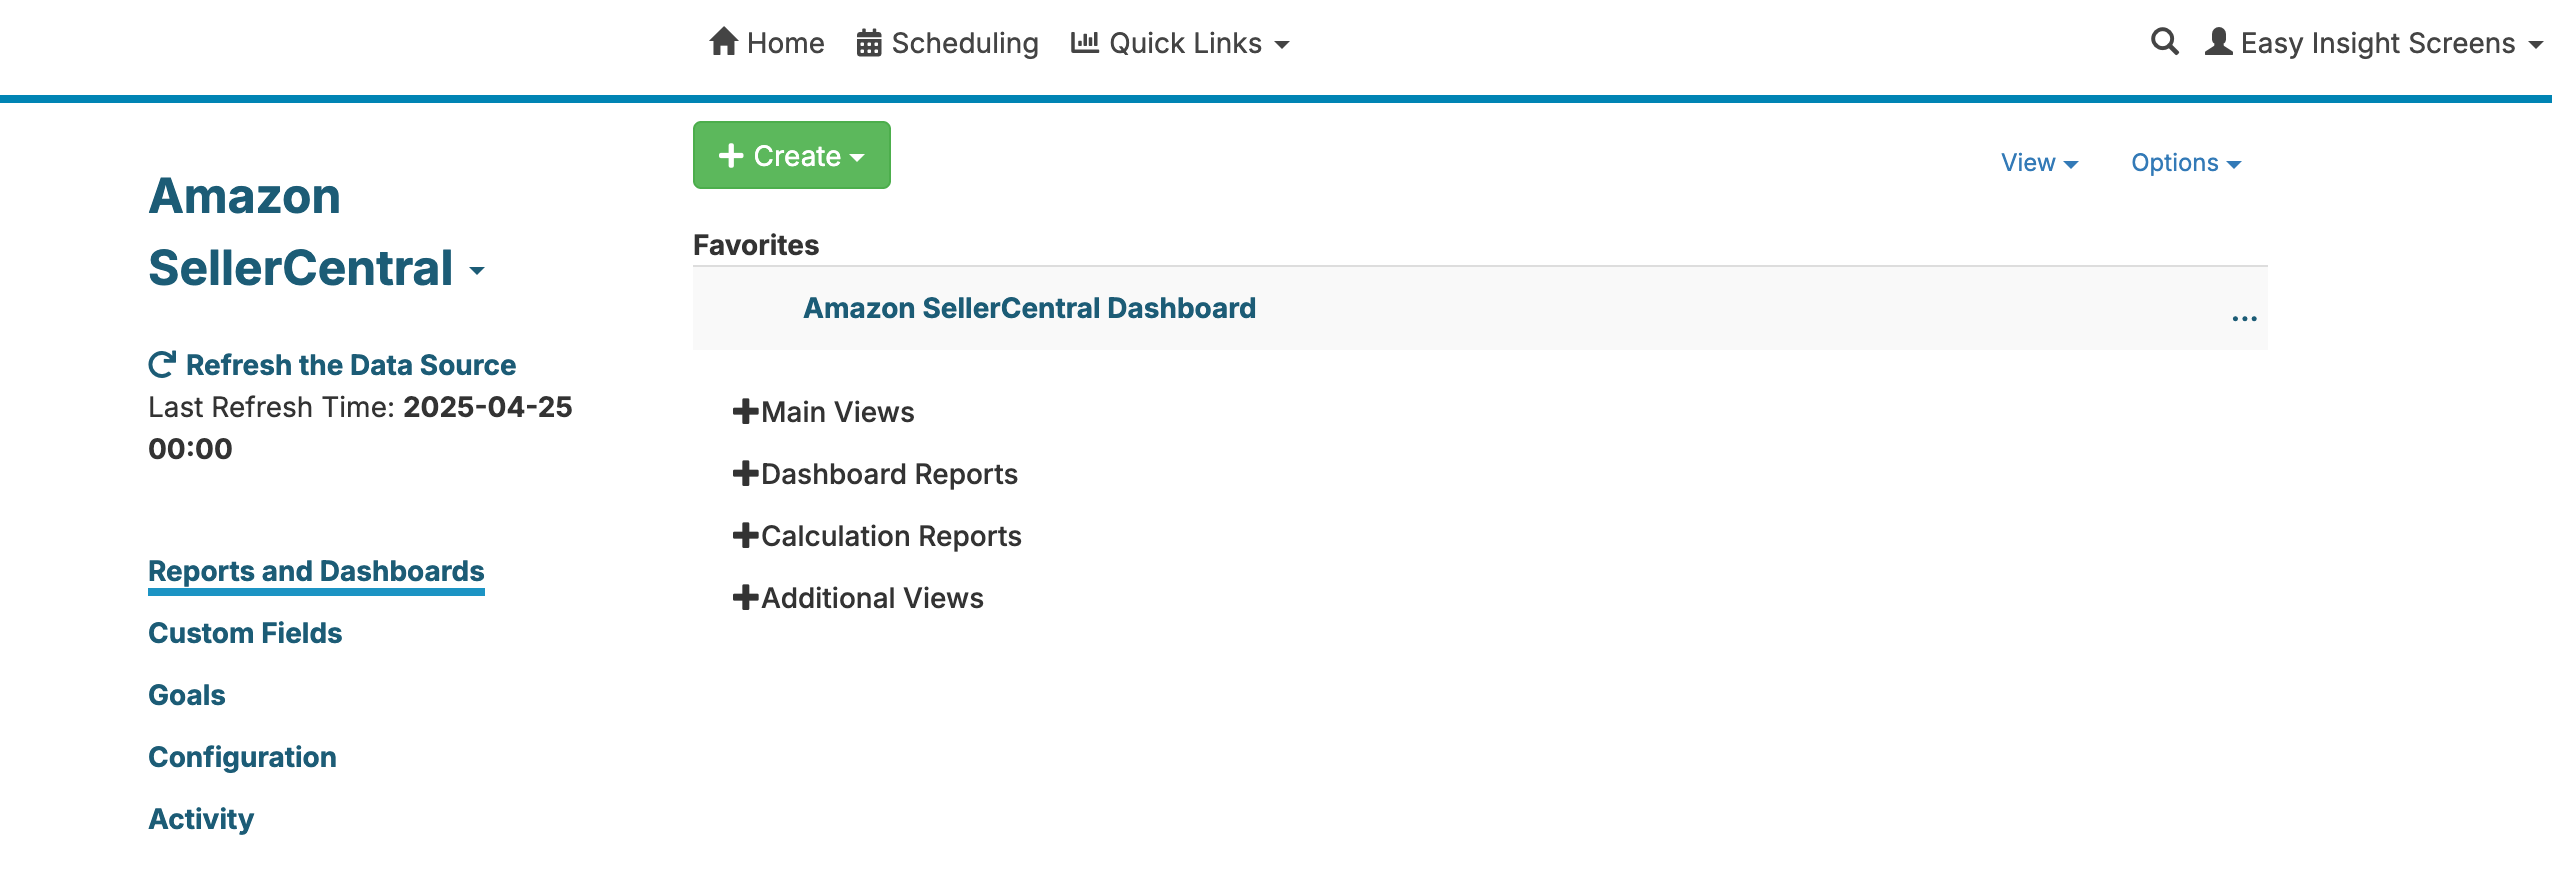
Once you've connected a data source in Easy Insight, you can go to its data source screen from the Home page:
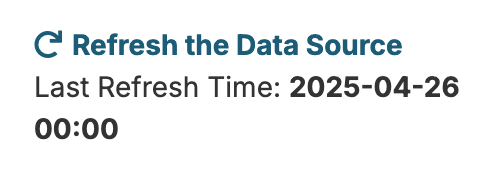
You can see your last refresh time and an option to trigger an on demand data source refresh:
For more information on scheduling your data source refreshes, see Scheduling.
You can create new reports or folders by clicking on the Create button. Your reports and dashboards are shown in the right. The 'Favorites' section provides a way to organize your top reports and dashboards for frequent access:
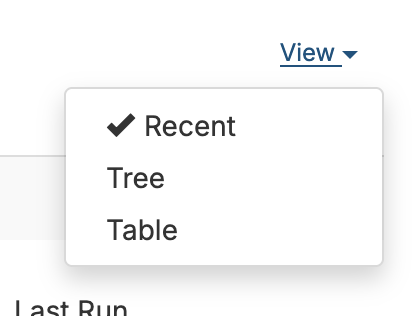
Your other reports and dashboards are shown below the Favorites. You can change the view between Recent, Tree, and Table to help organize and find the report you're looking:
You can click on the three dots to the far right of the report name to edit or favorite the report.
The 'Recent' view sorts by the most recently accessed reports:
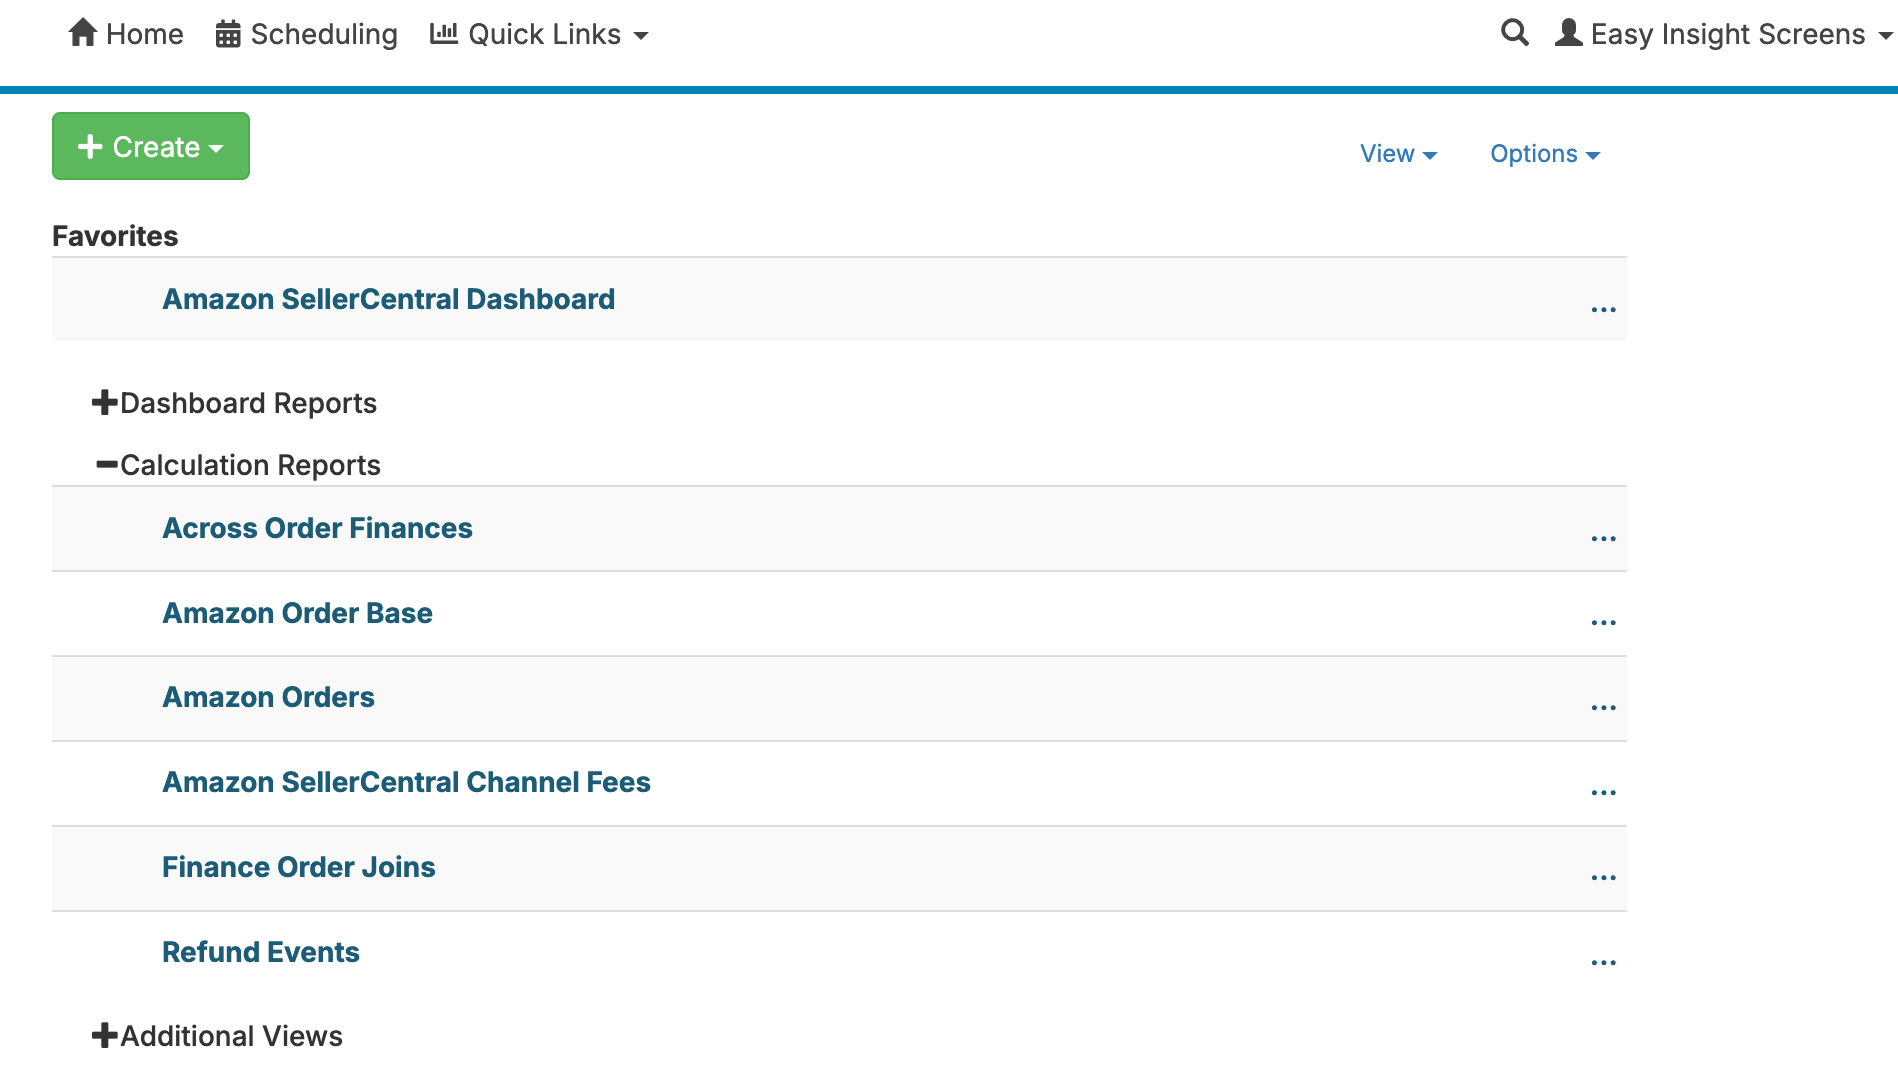
The 'Tree' view allows you to group reports into folders. You can add new folders by clicking on Create and choosing Create Folder. You can move reports between folders by clicking on the three dots next to the report and choosing the folder to move the report into:
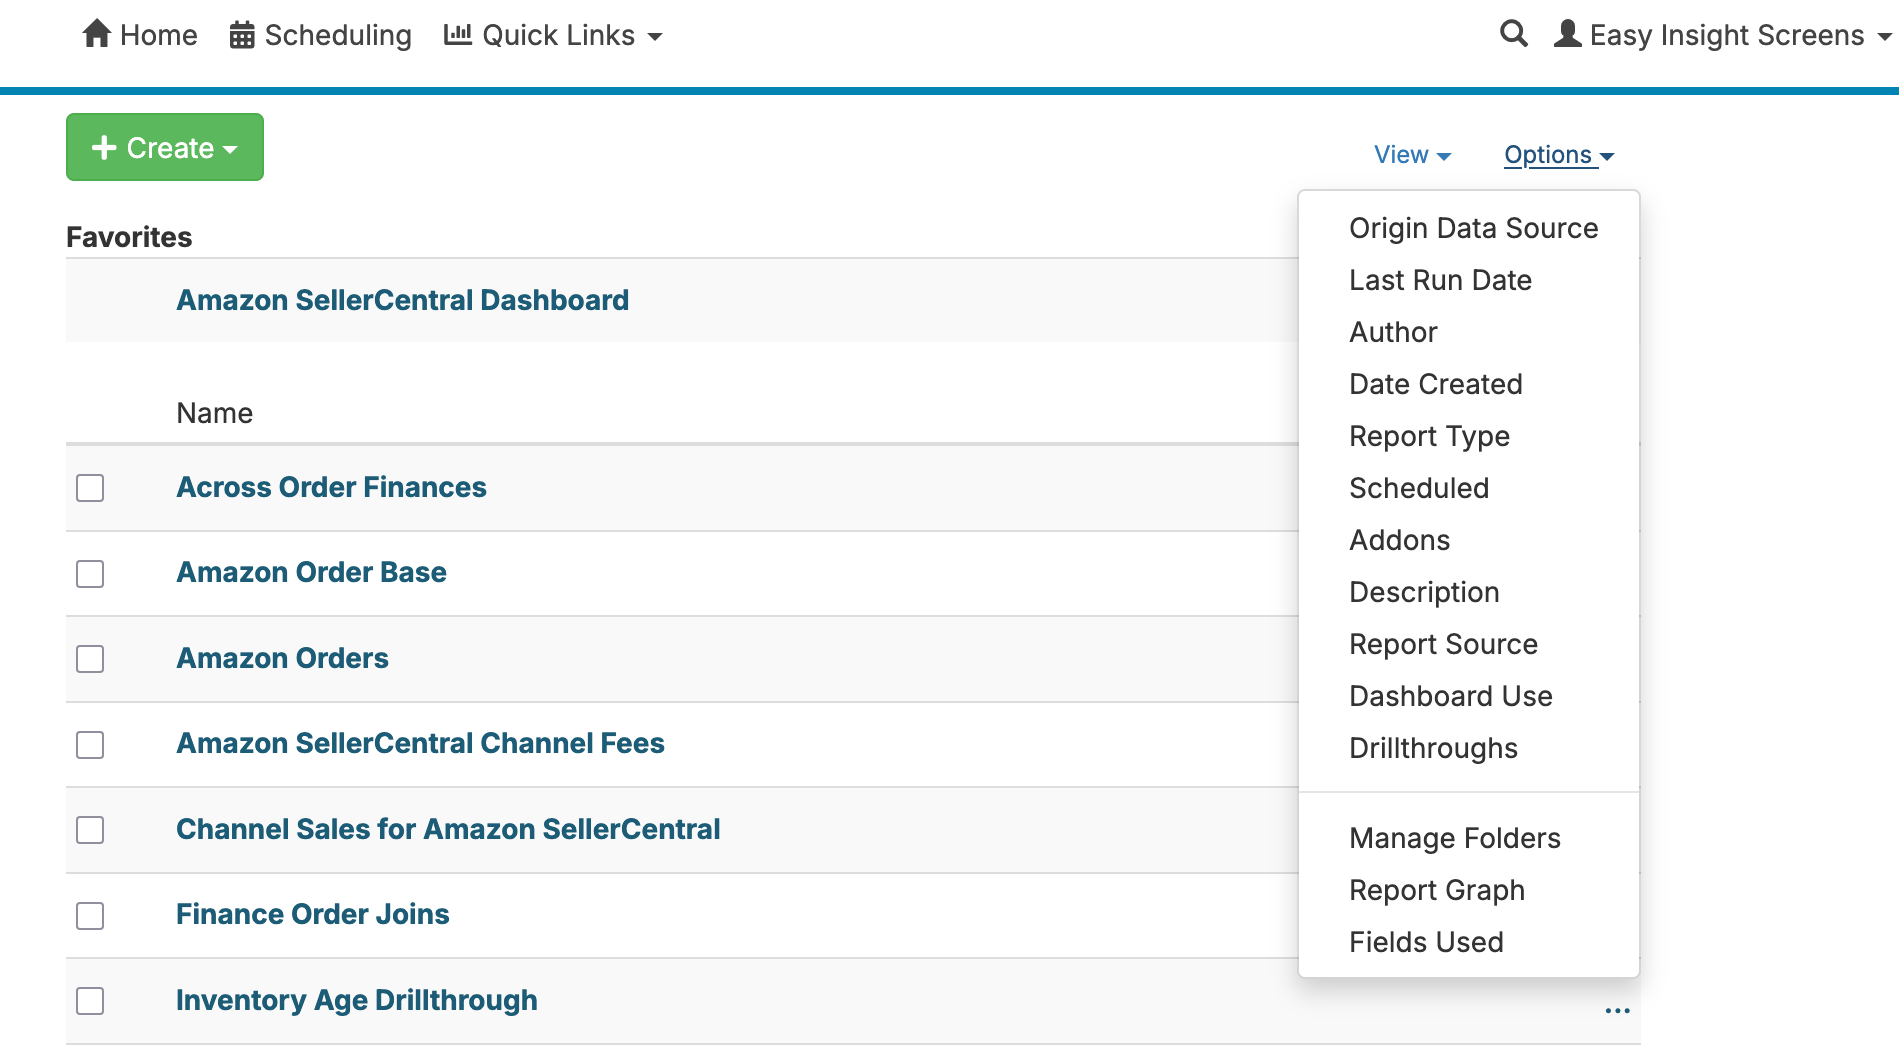
The 'Table' view allows you to view reports as a sortable table. You can add additional columns to the table through the 'Options' dropdown: