Easy Insight Logo
Call 1-(720)-316-8174

Easy Insight and Teamwork CRM Documentation

When you first install your connection to Teamwork CRM in Easy Insight, you'll get a prebuilt dashboard with a variety of reports to help you get started. You can customize any of these reports or replace them with your own.

The dashboard includes the following pages:


Overview

Teamwork CRM Dashboard Overview

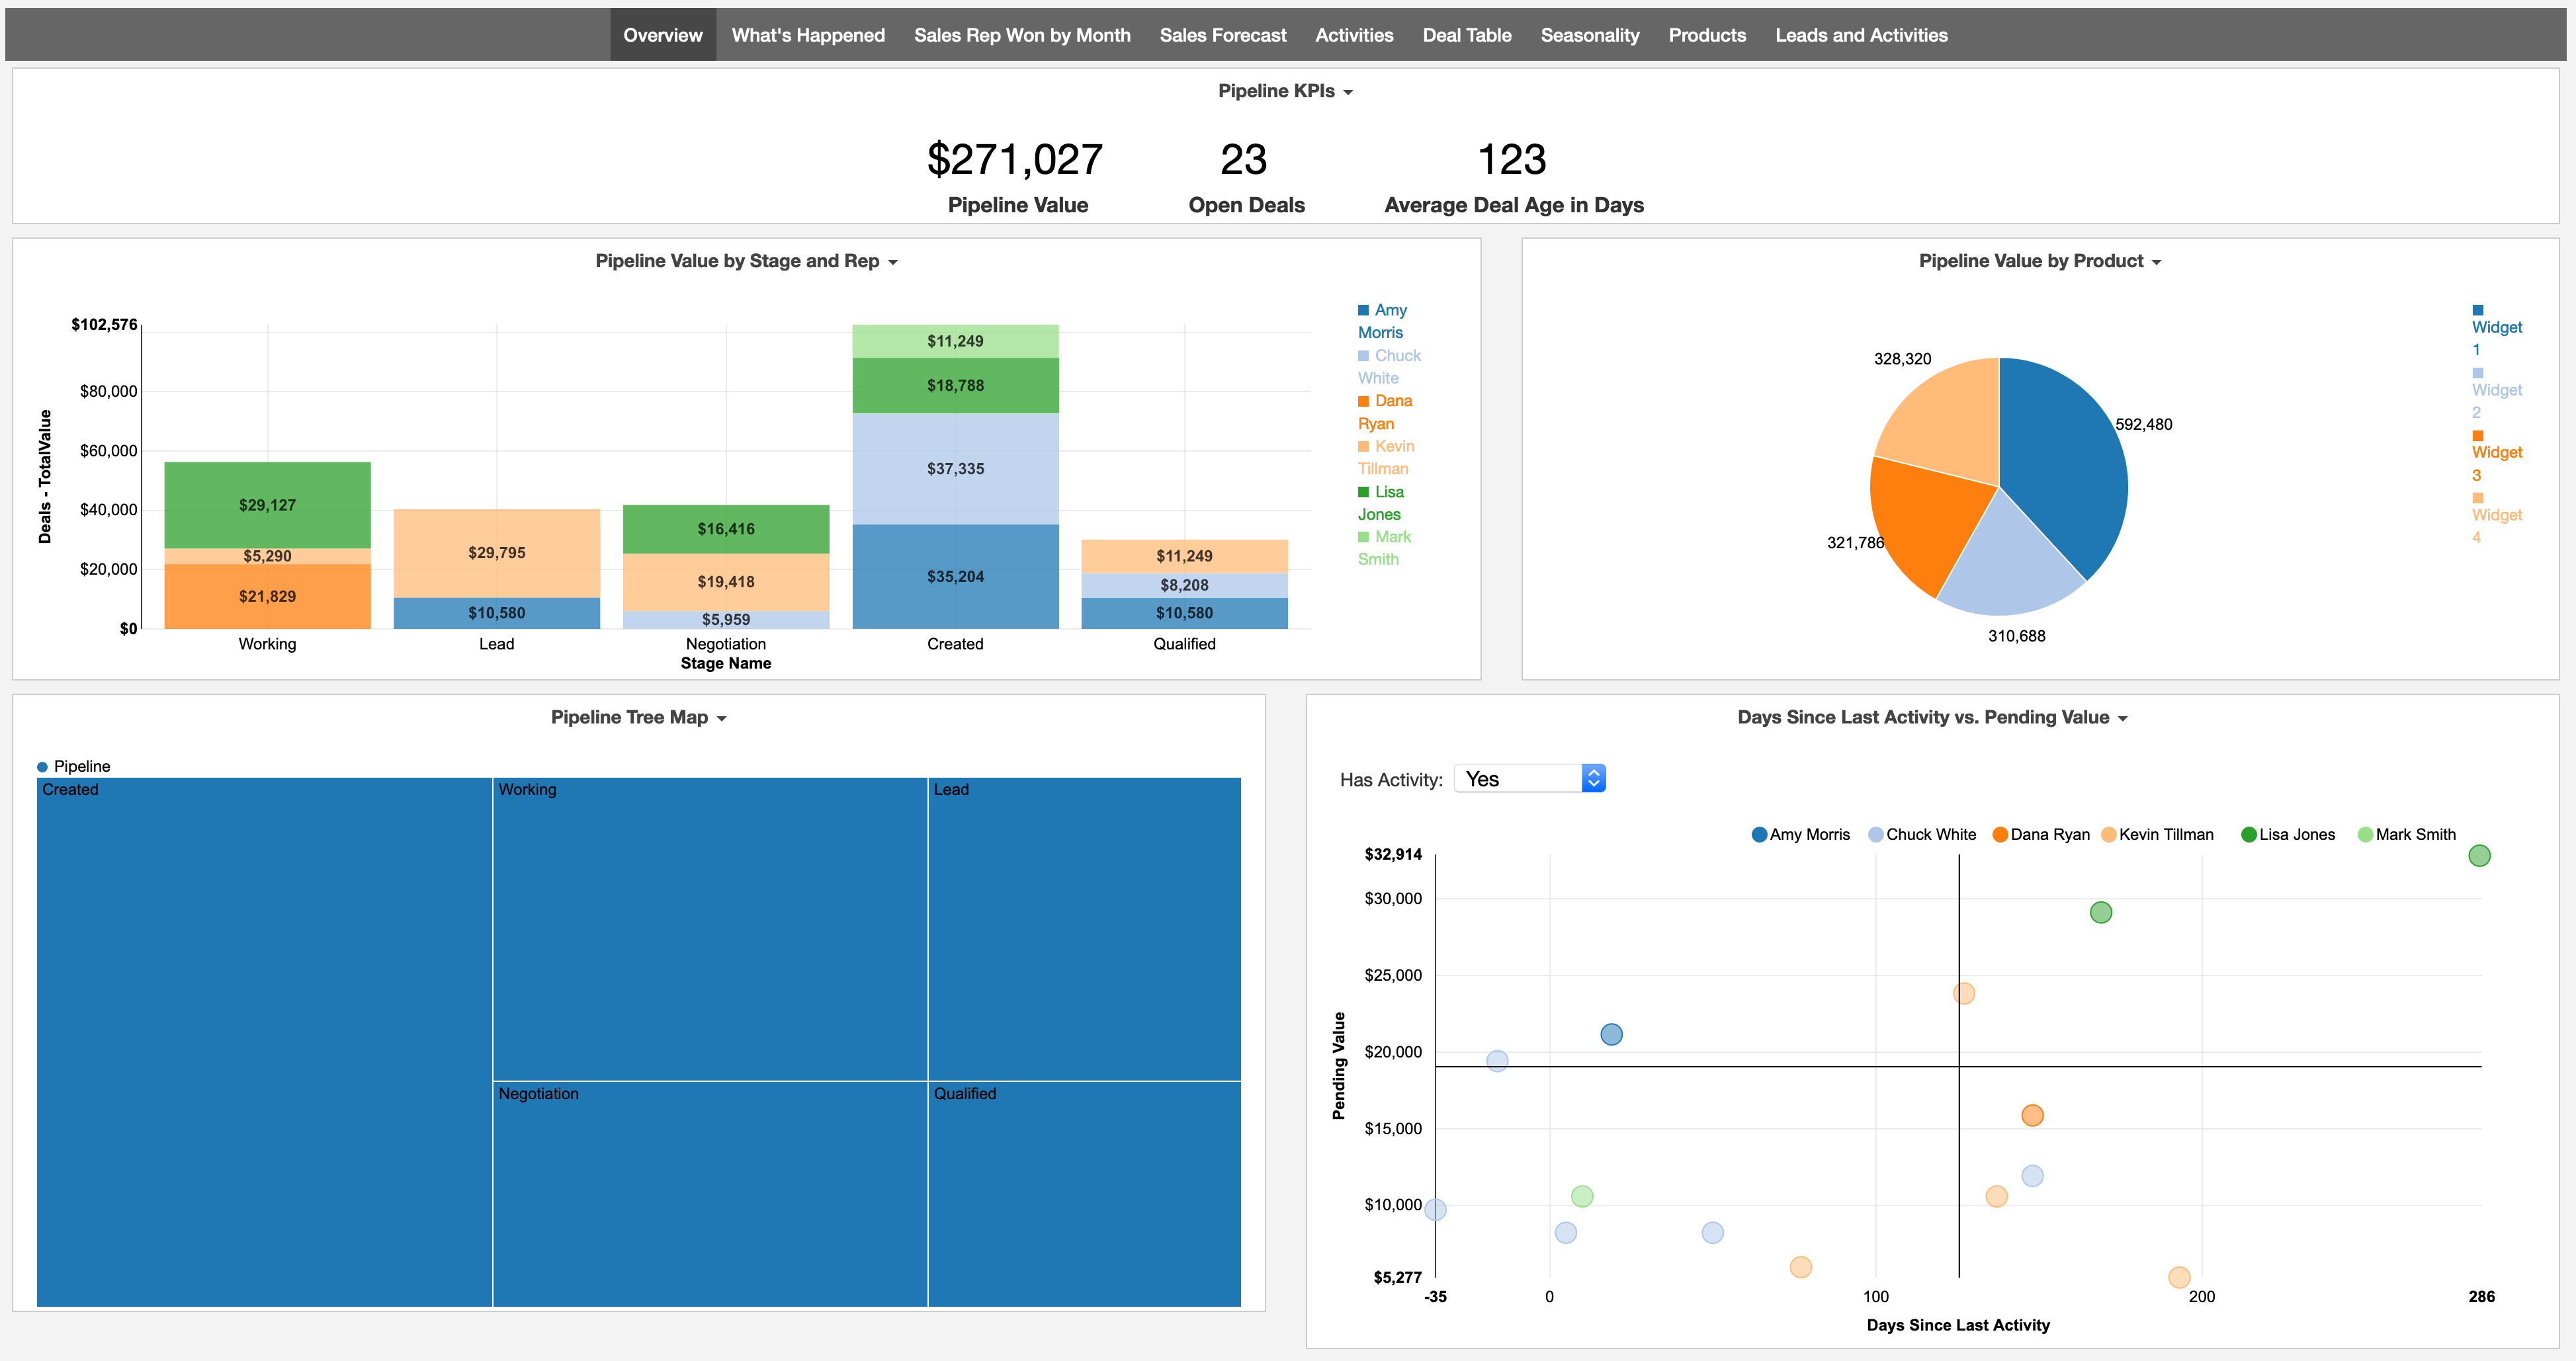
The overview provides a view into your pipeline key performance indicators, visualization of who has what amount of deals at which stages, a break down of pipeline by product, a visualization of pipeline and stage value as a tree map, and a chart to help you see which highest dollar deals are at the highest risk due to lack of activity.


What's Happened

Teamwork CRM Dashboard Overview

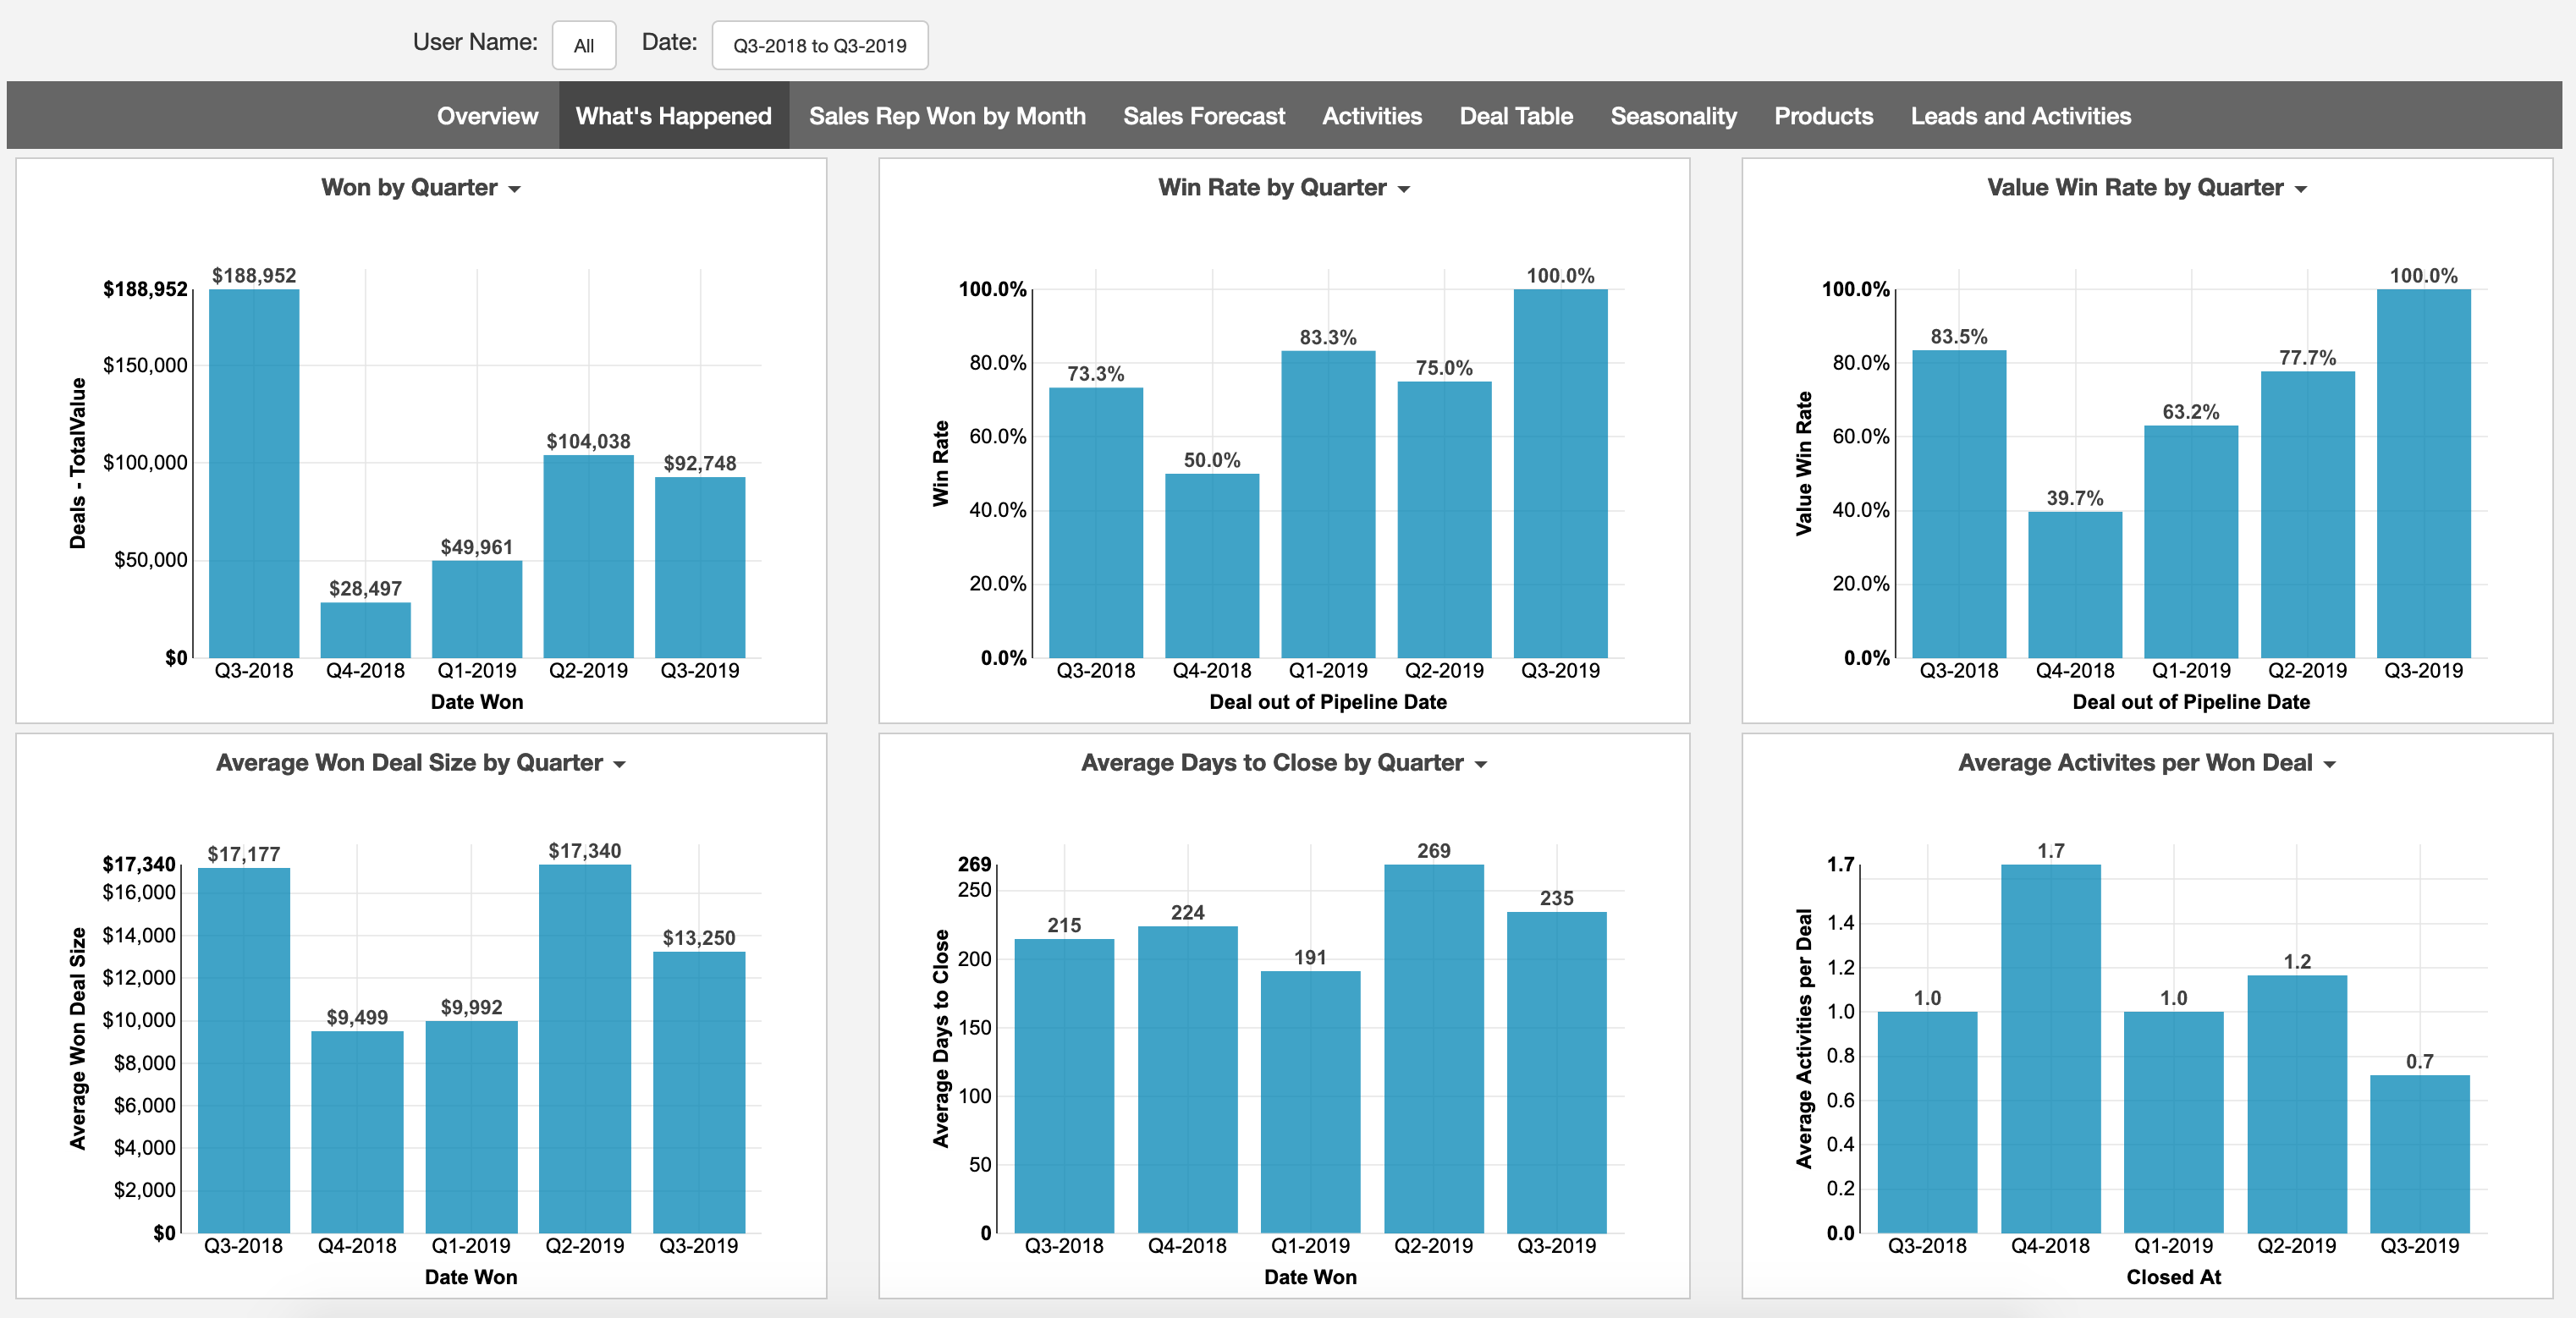
The What's Happened page helps you understand trends in sales performance. You can adjust the date filter to view different ranges of quarters. The charts give you a visualization of trends in deal volume, win rate, average activities per deal, and more.


Won by Sales Rep and Month

Teamwork CRM Dashboard Overview

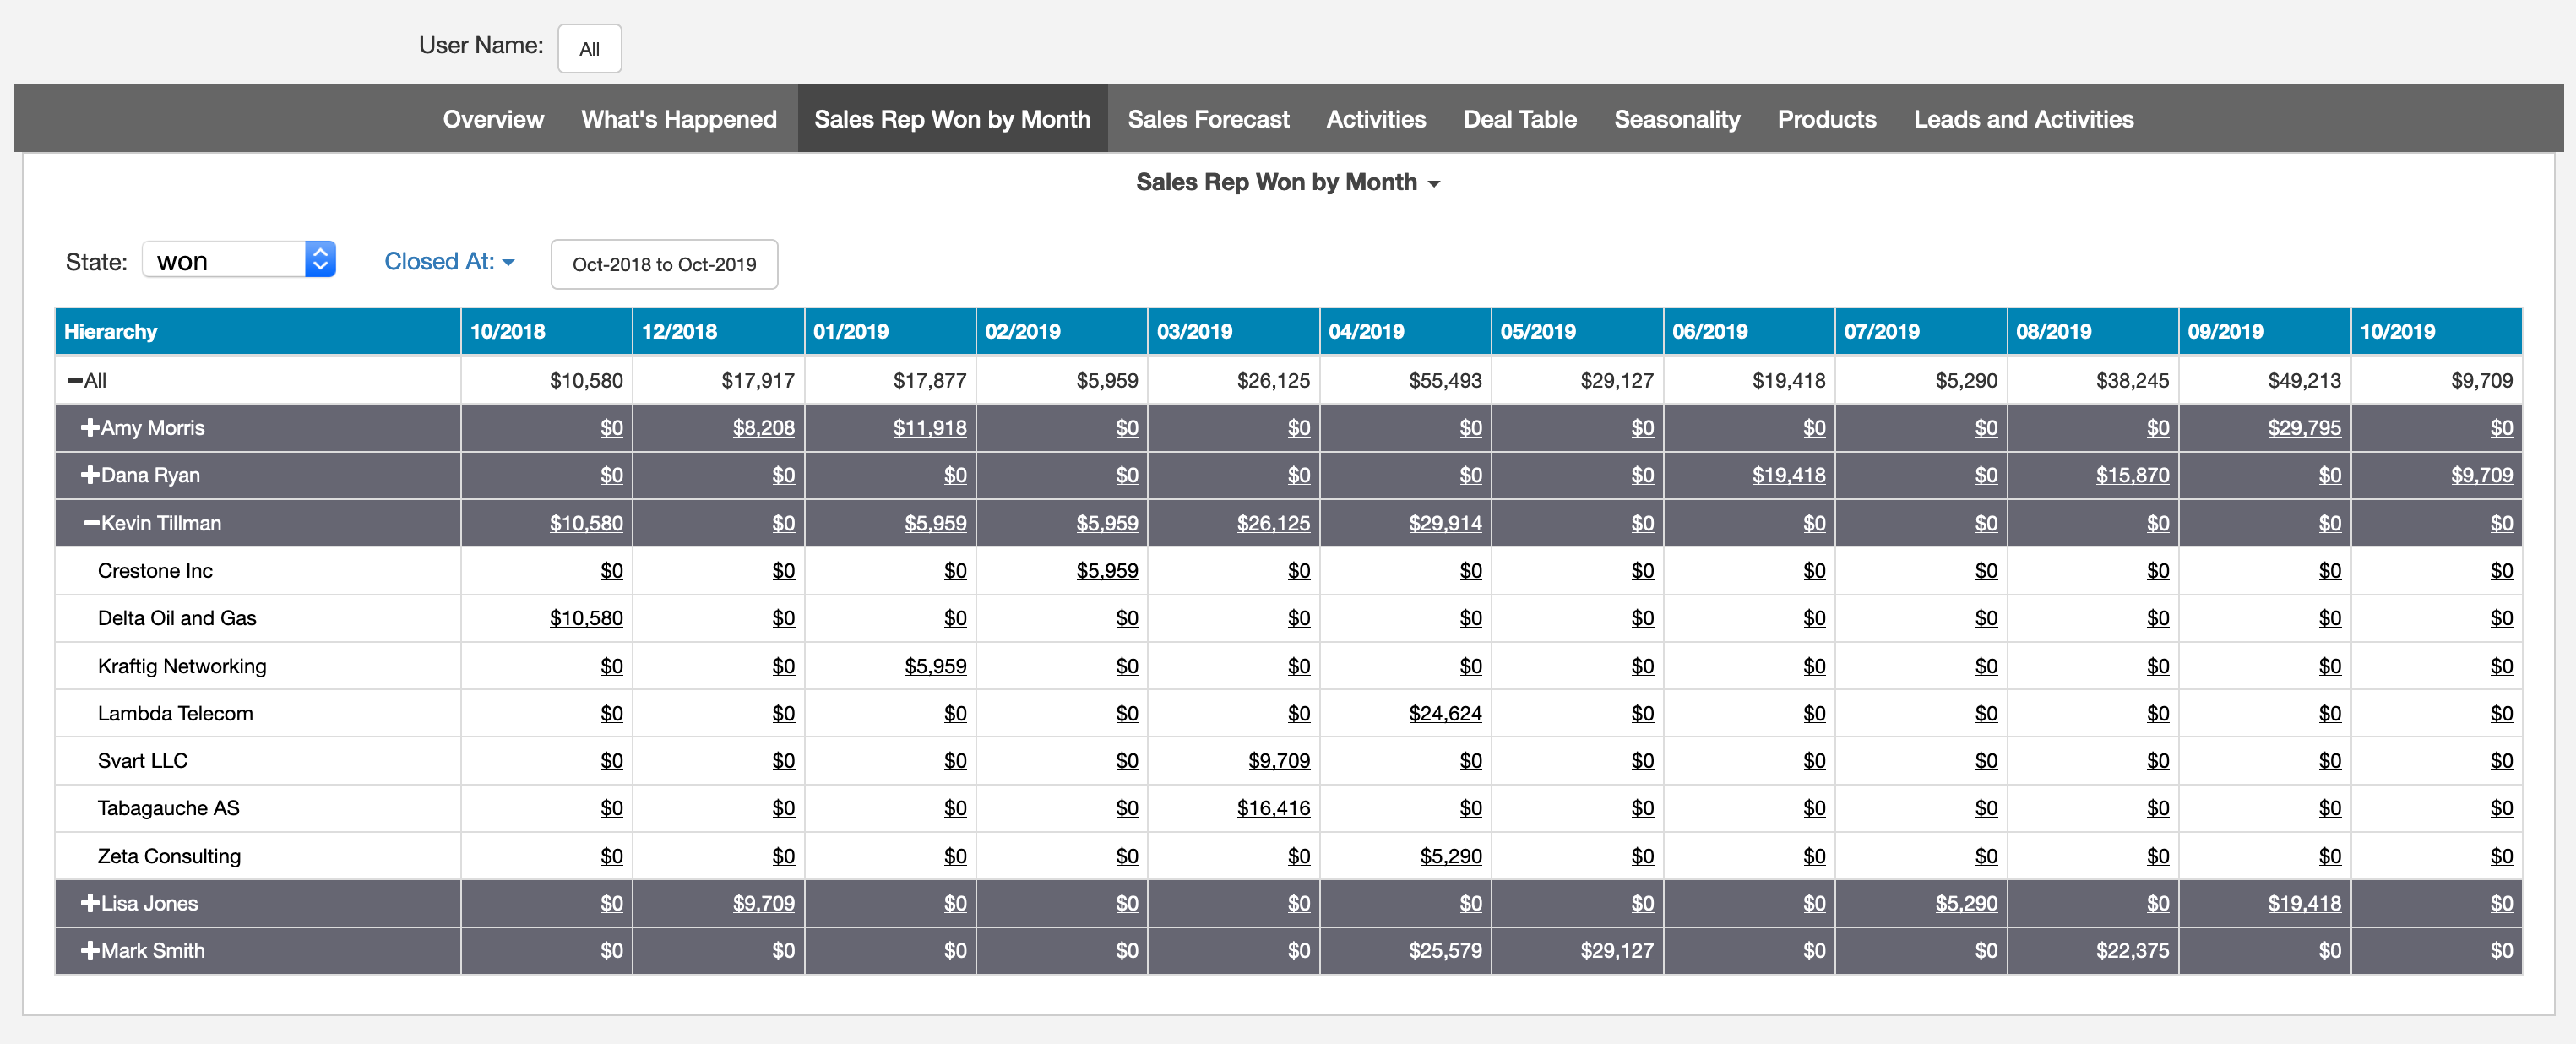
The Won by Sales Rep and Month gives you a tree report that looks at won deals by sales rep, with the ability to easily dive into a particular sales rep to see specifics regarding won deals. The columns of the tree map automatically expand out by month based on your date filter.


Sales Forecast

Teamwork CRM Sales Forecast

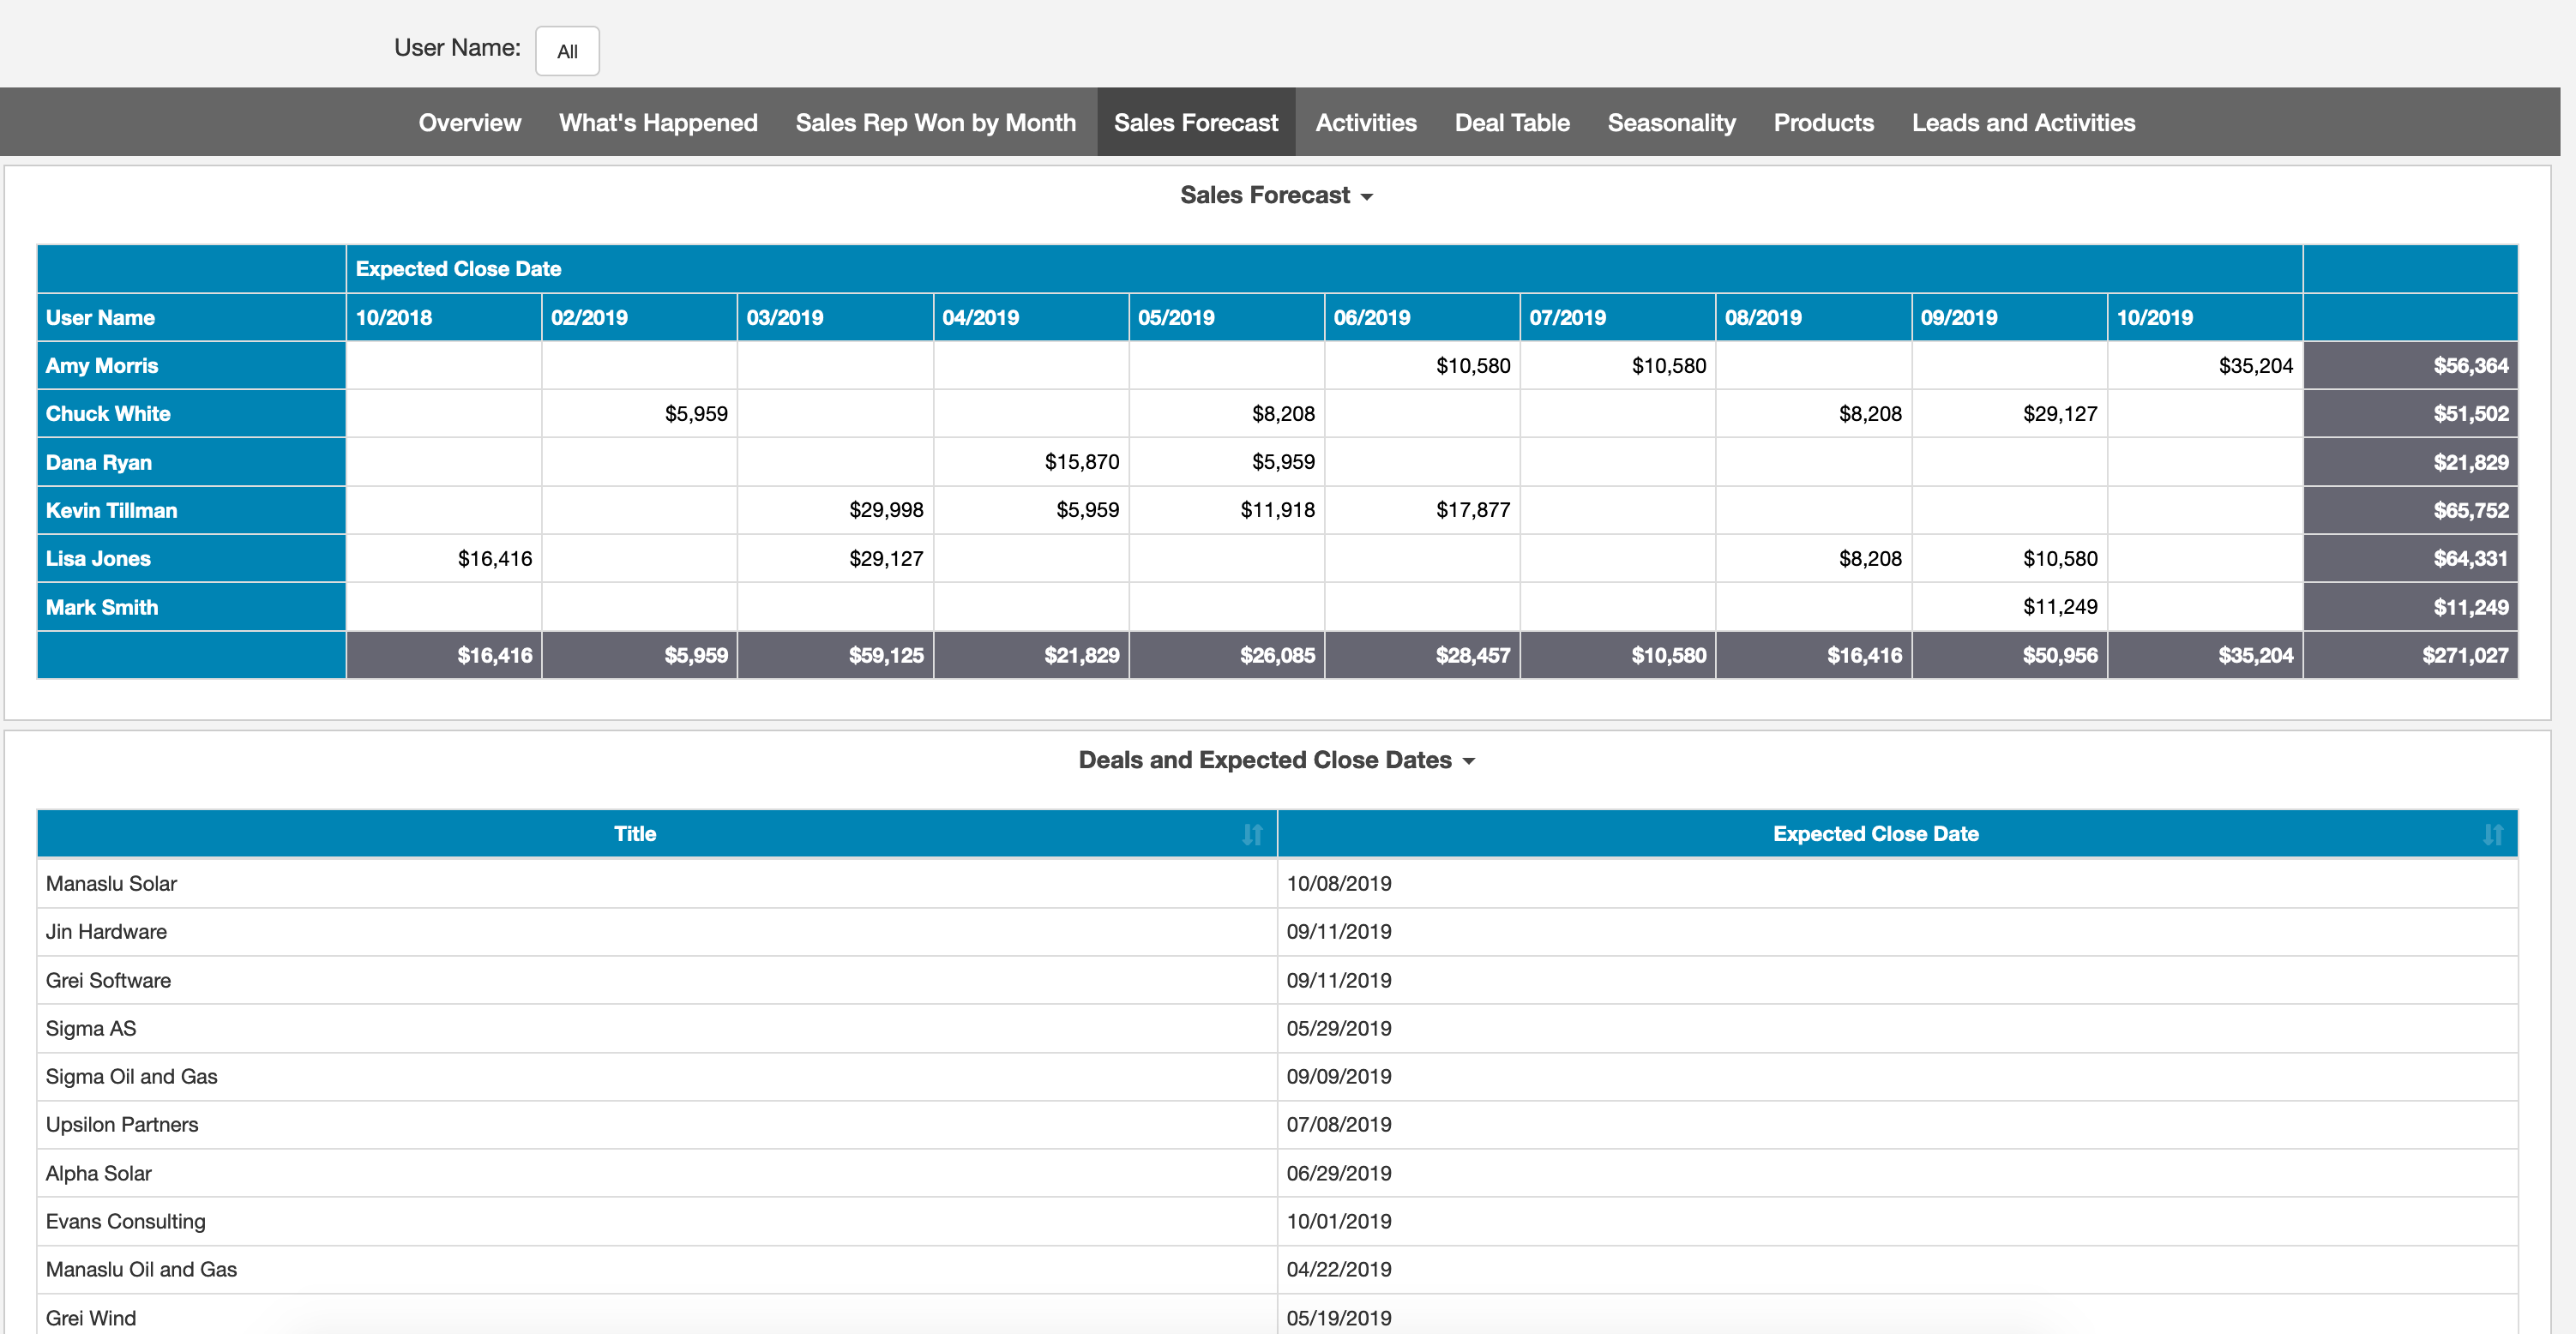
The Sales Forecast page shows you the projected value by sales rep over the different specified close dates for deals. An additional table below shows you the close date for each, including those with no expected close date so that you can go into your data and update values where they need to be.


Activities

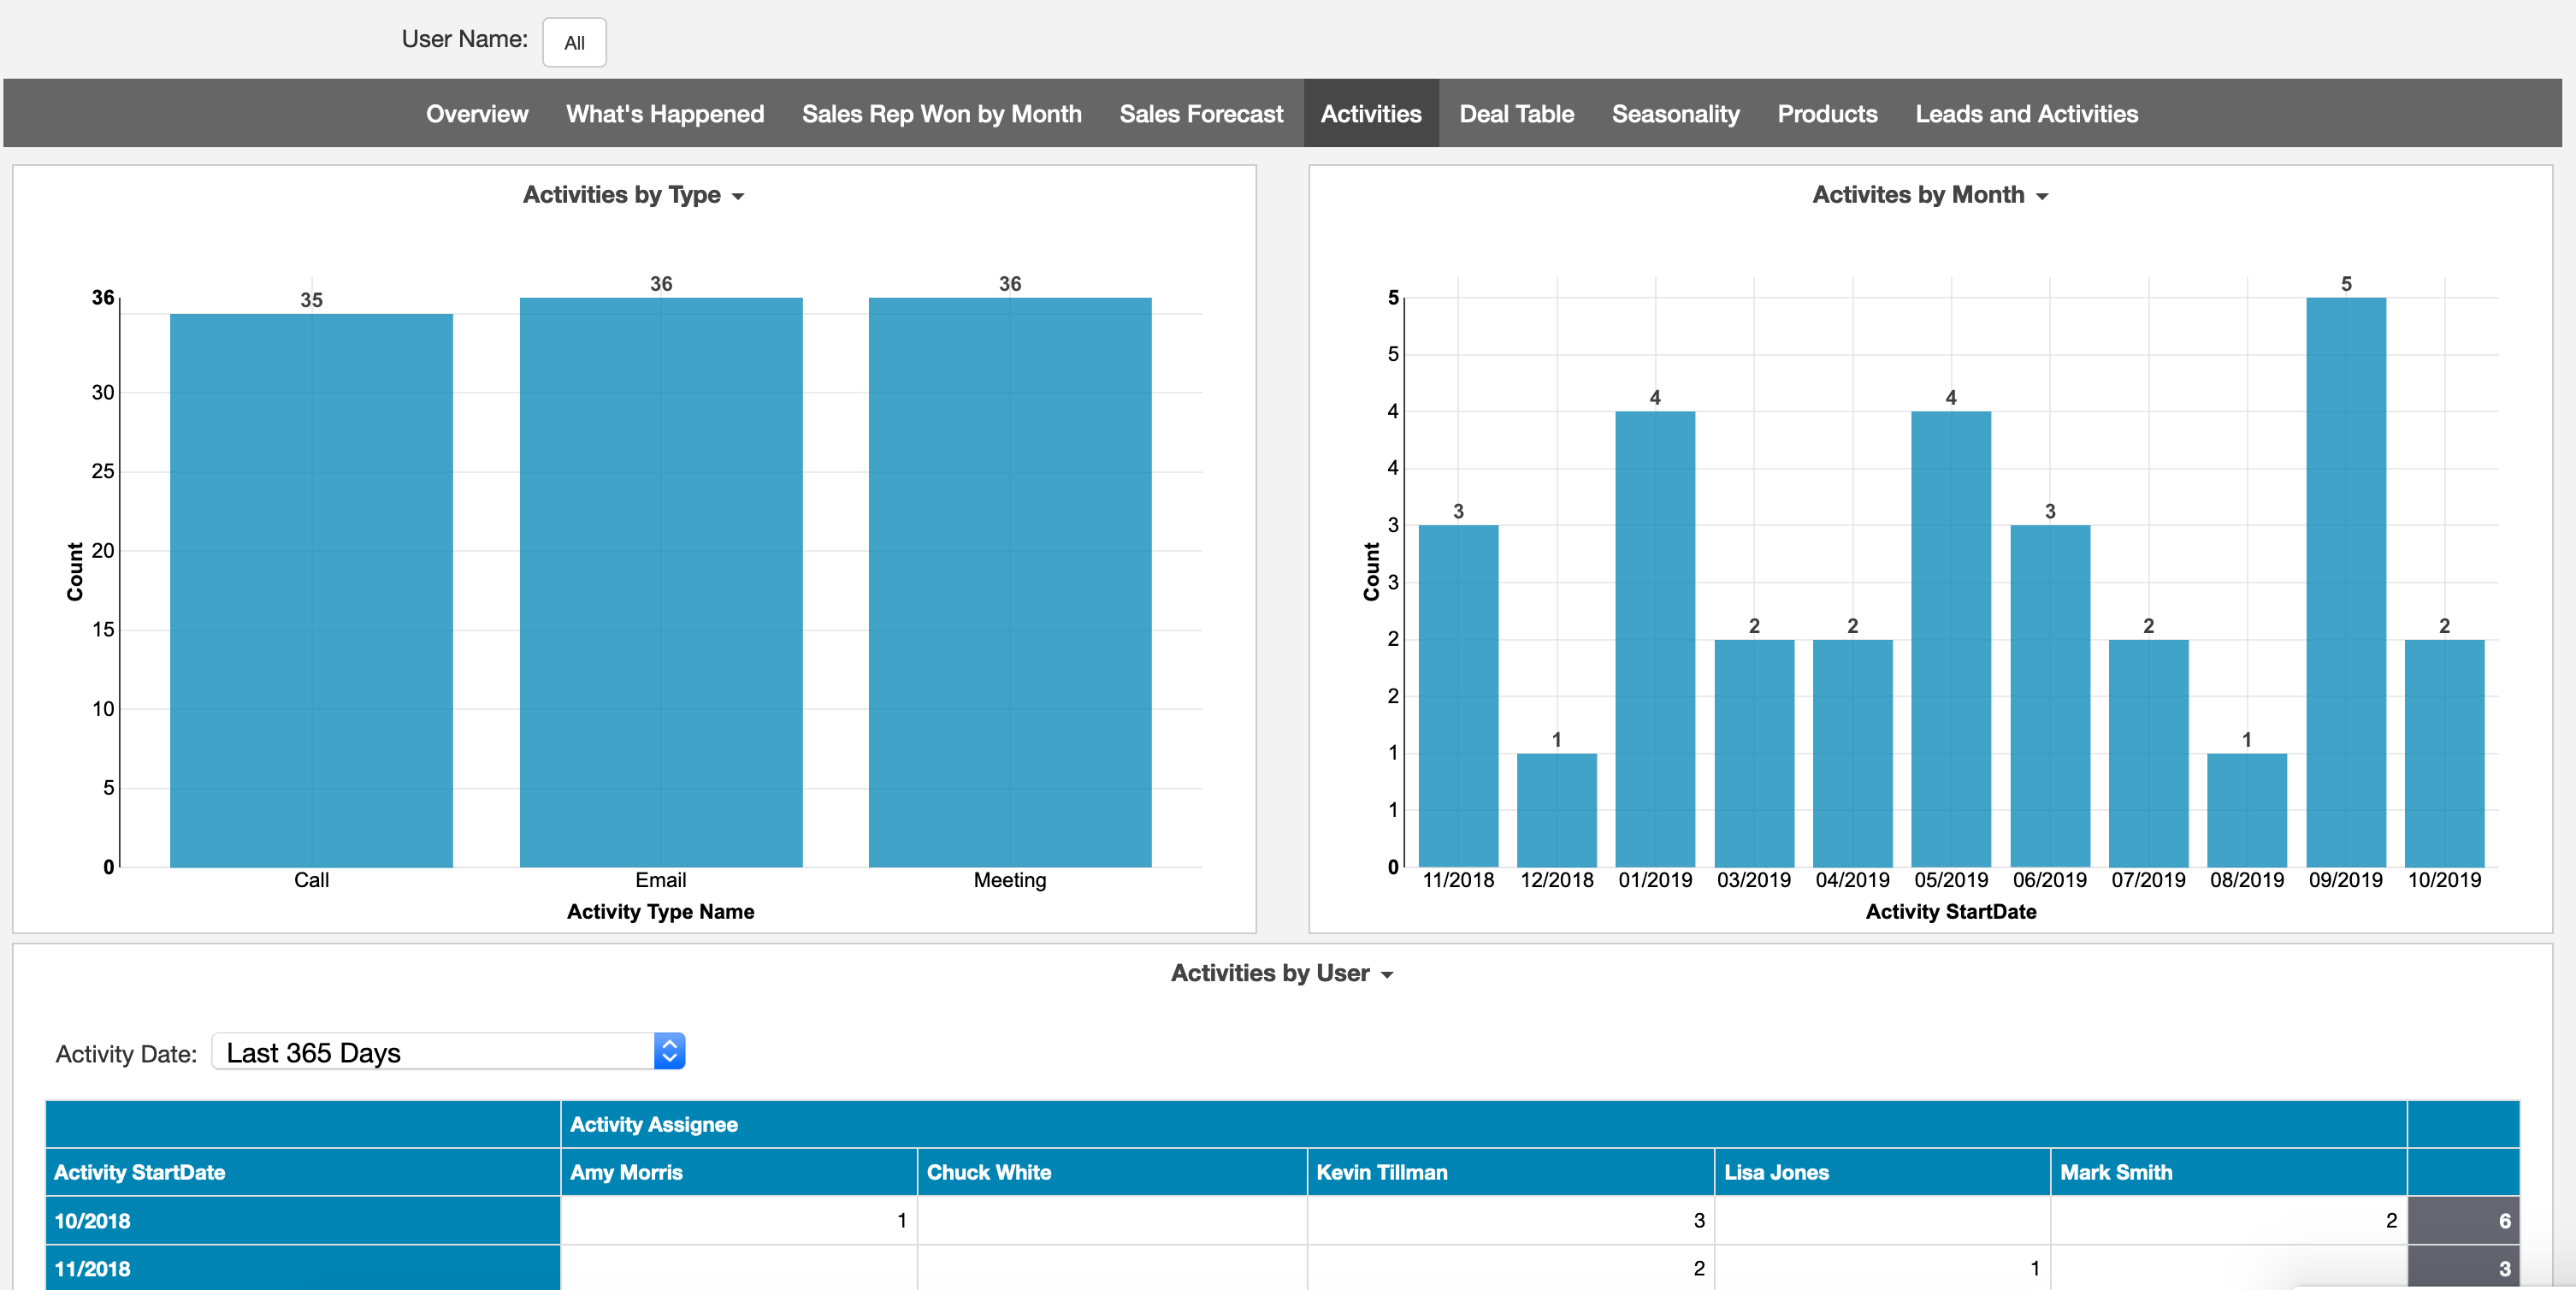
Teamwork CRM Dashboard Overview

The Activities page helps you see the activities your team is doing to help close deals. You're able to visualize what types of activities have happened and who has completed what number of activities.


Deal Table

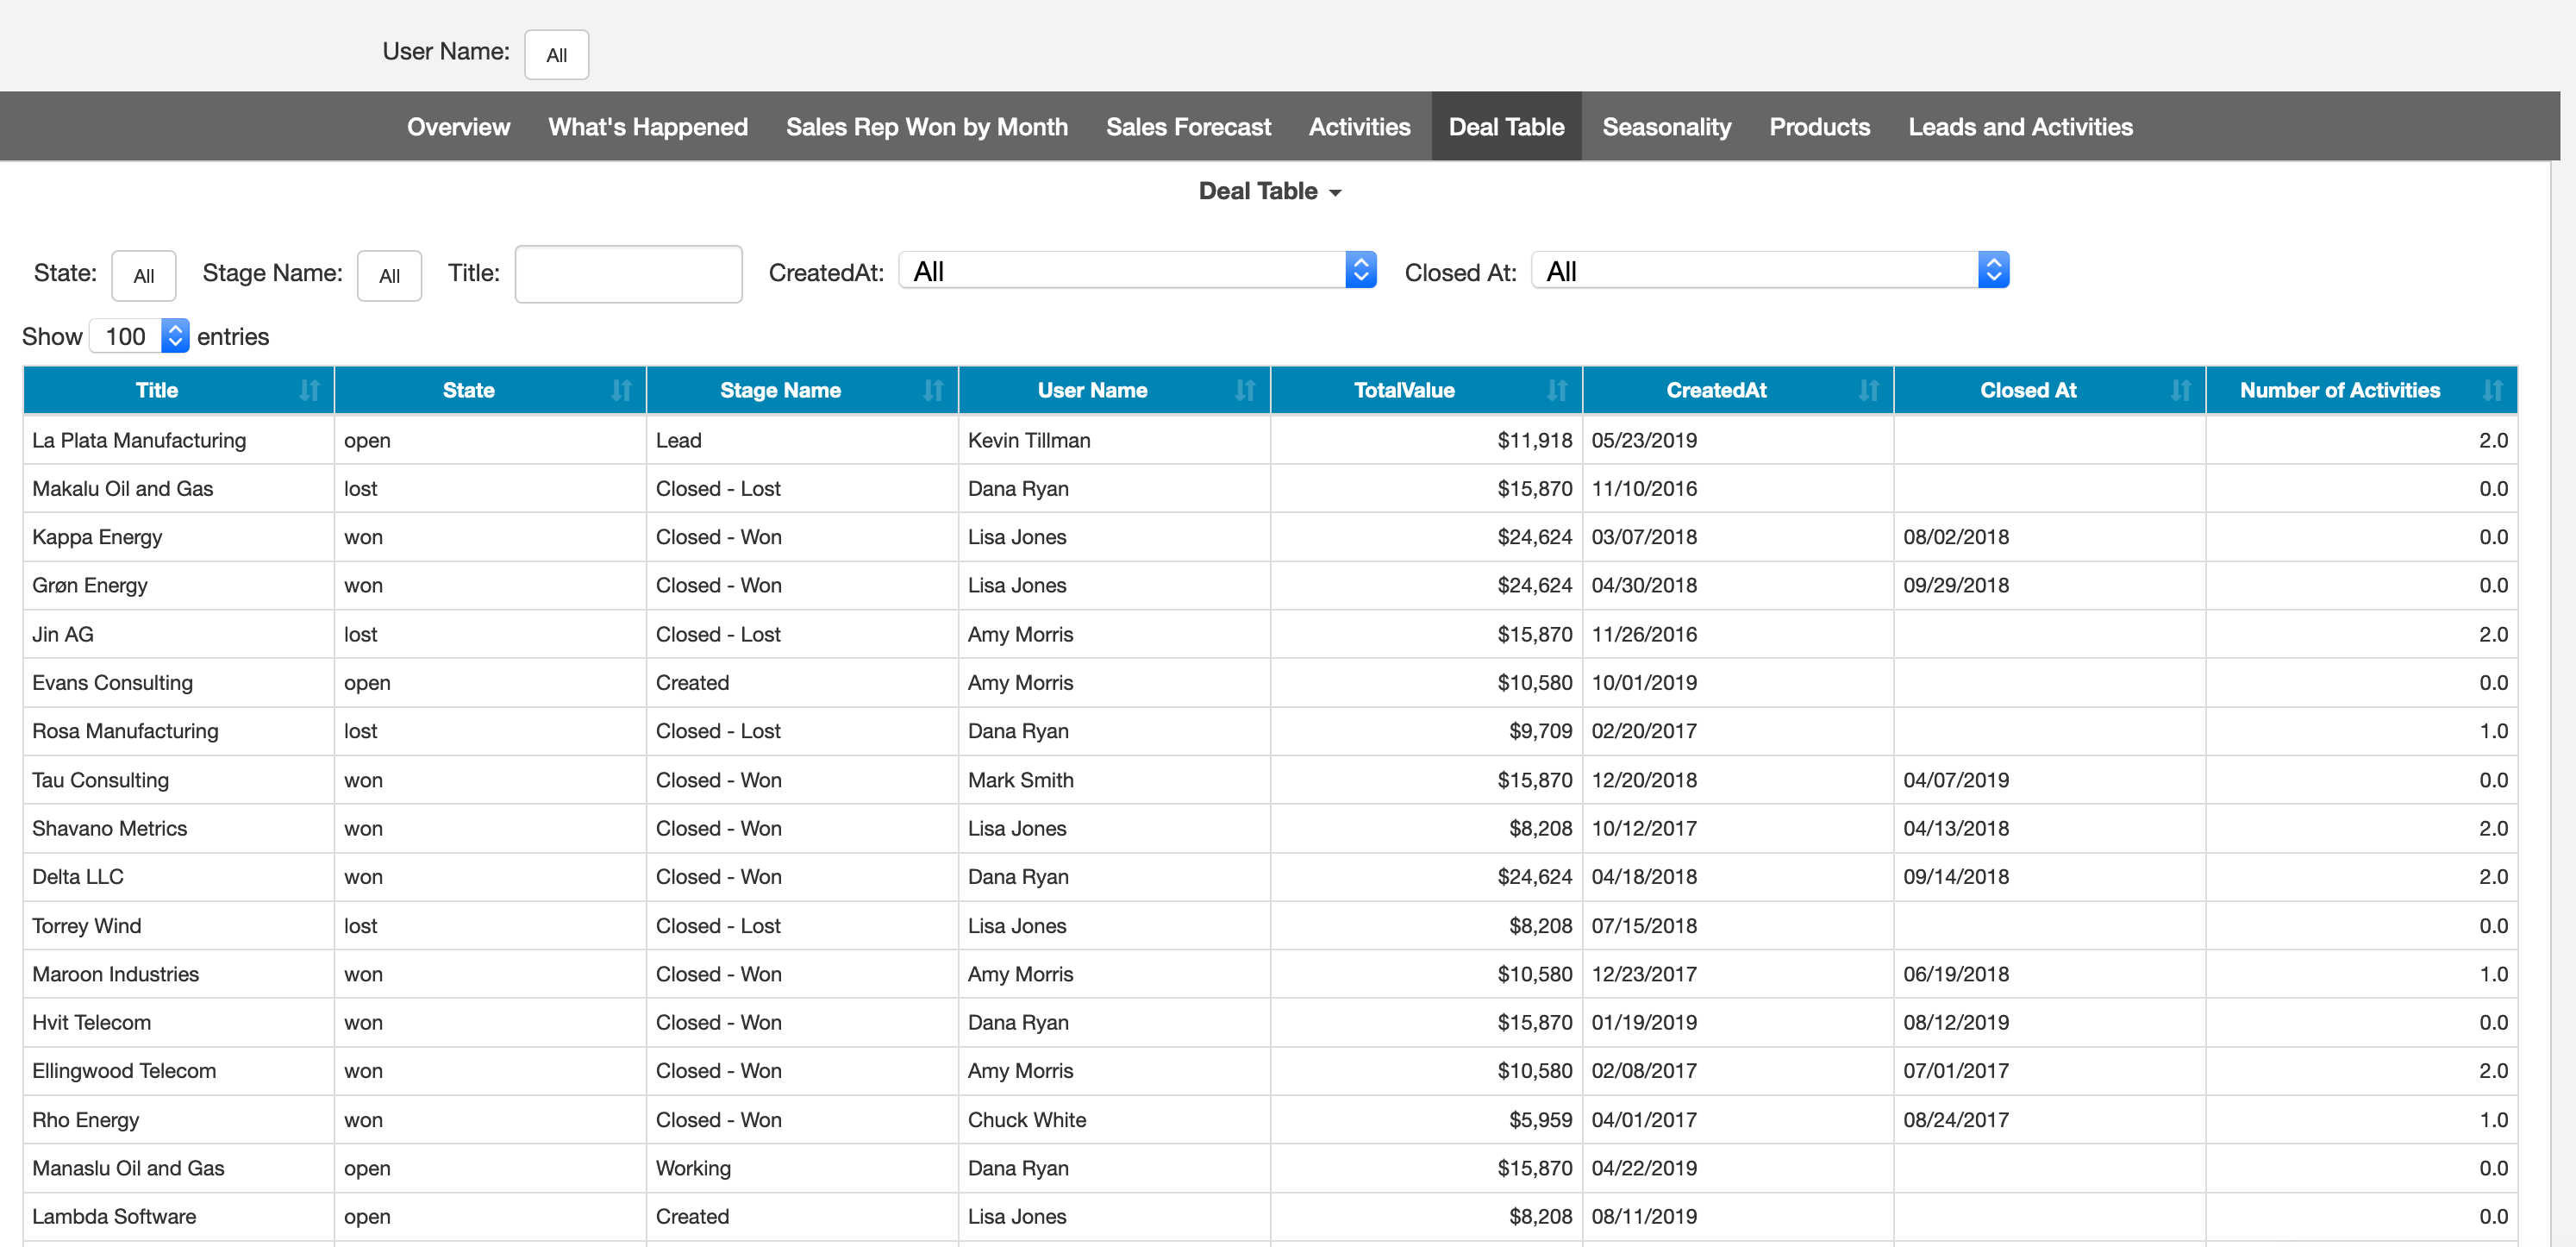
Teamwork CRM Dashboard Overview

The Deal Table gives you a searchable view across your deals with a variety of filters to help you pare down the results and zone in on specific details. This report is particularly good for exporting to Excel or PDF.


Seasonality

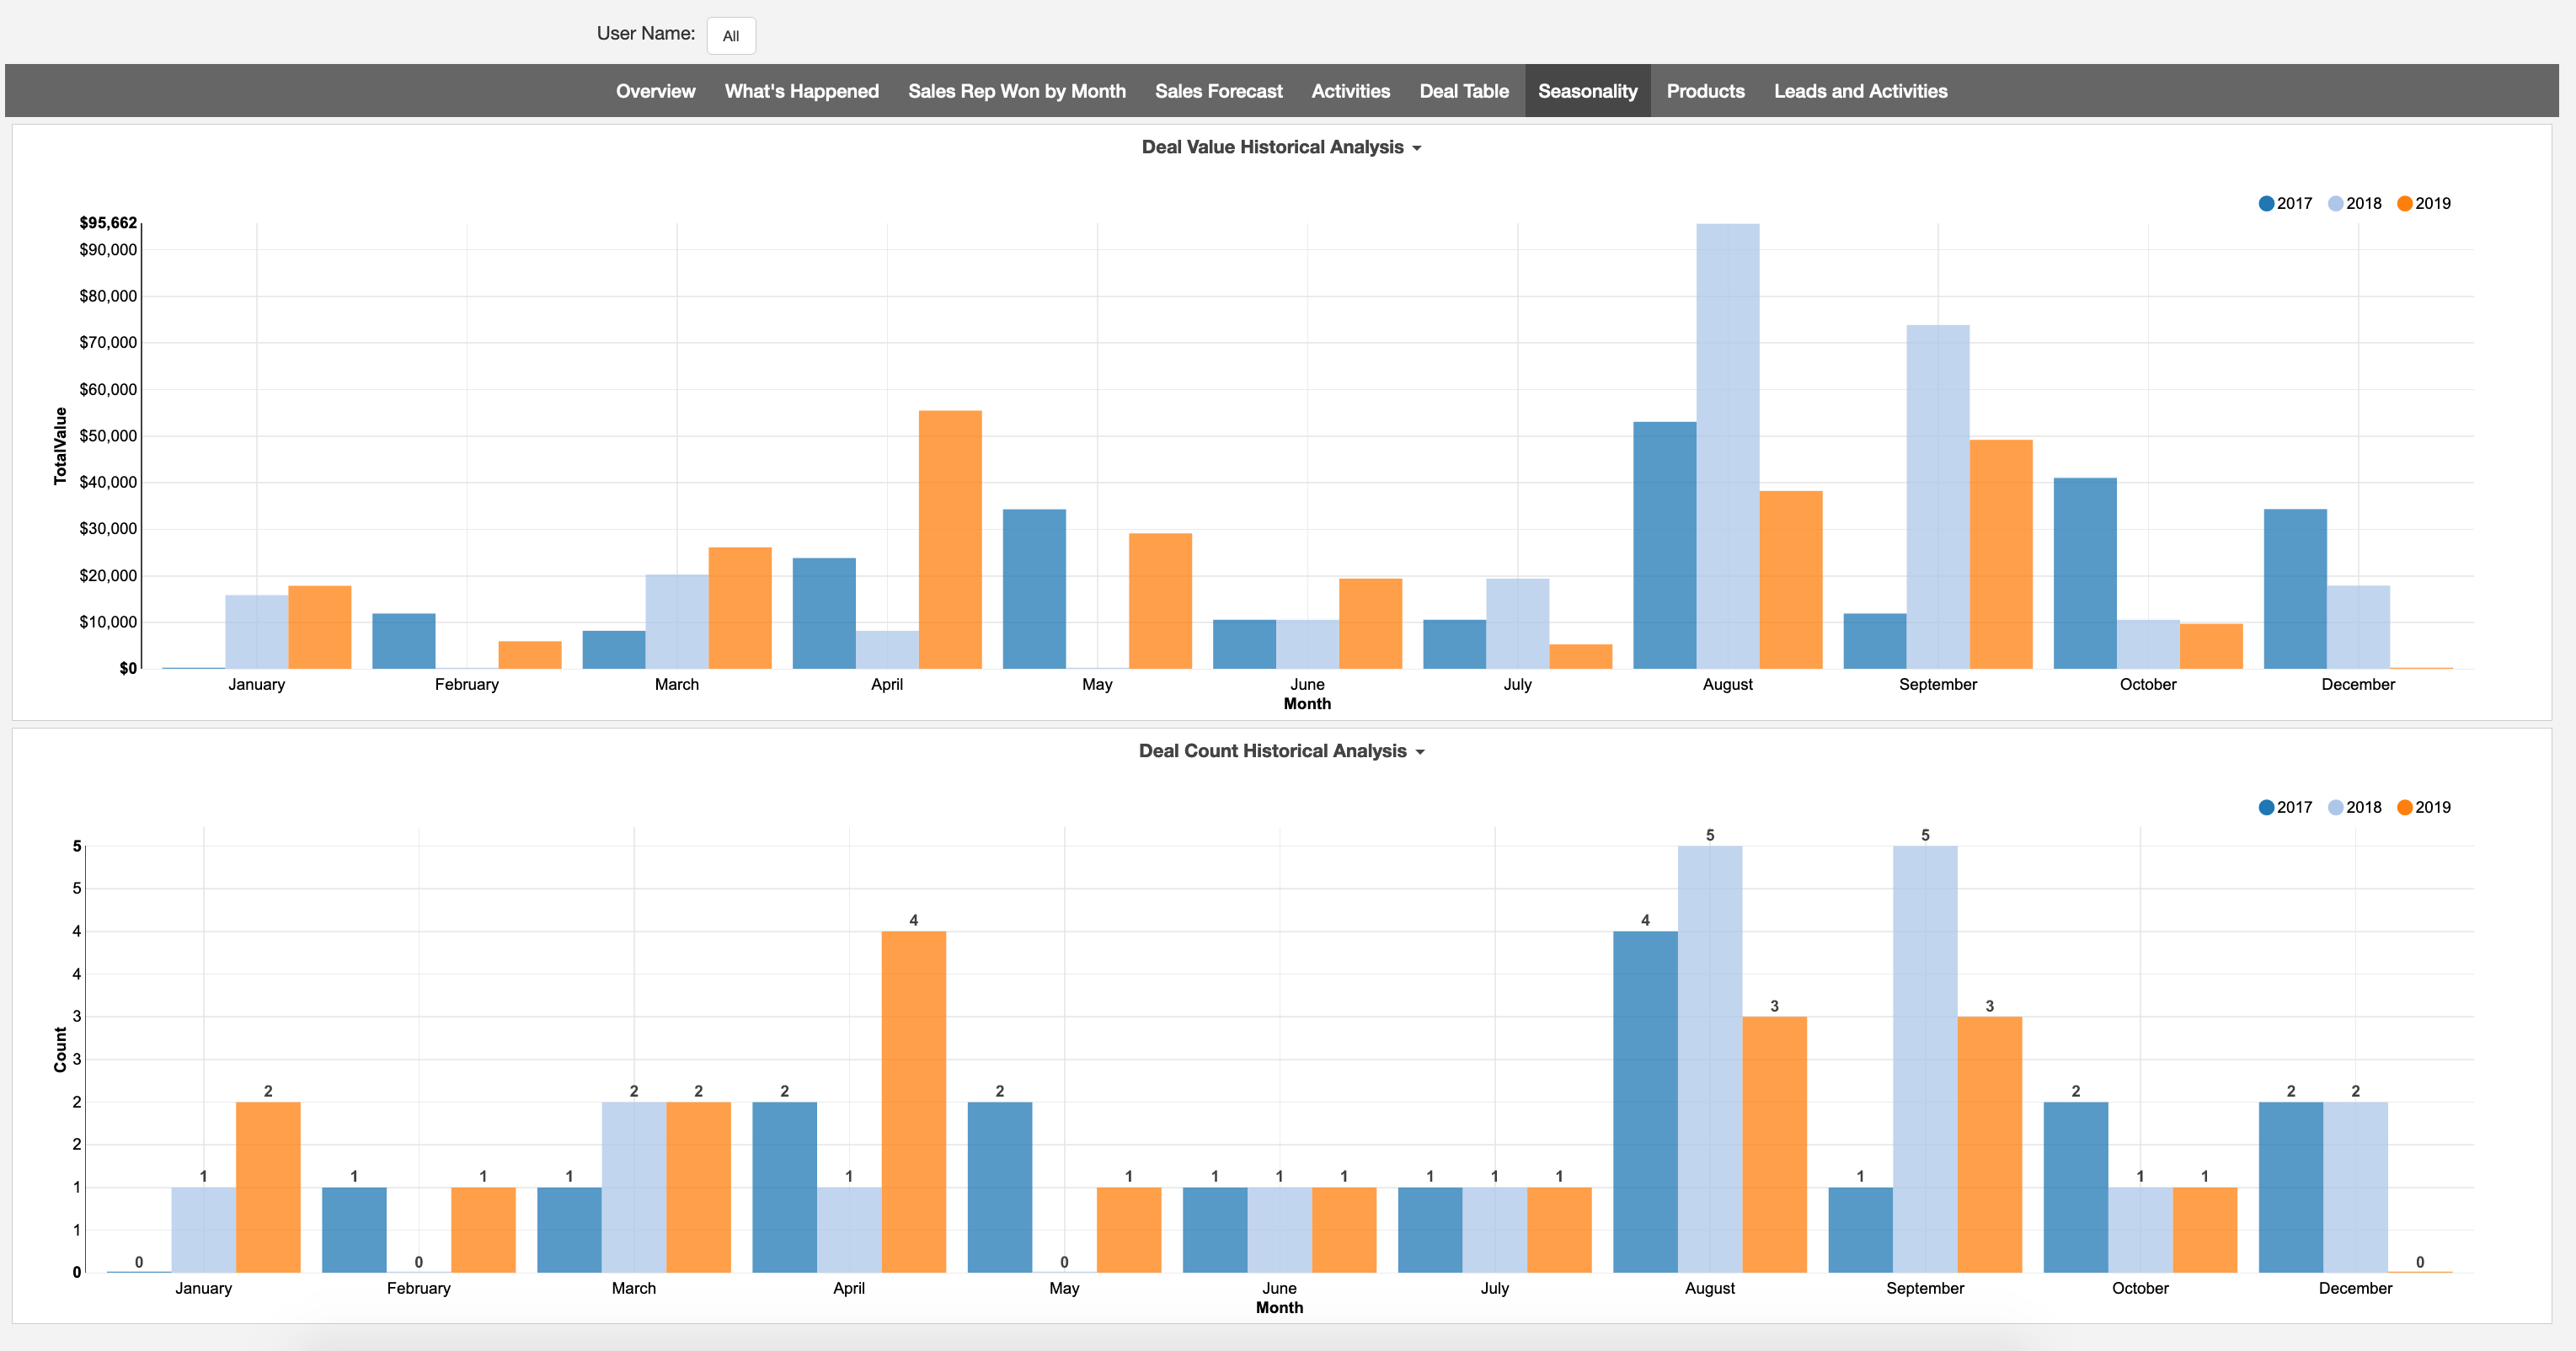
Teamwork CRM Dashboard Overview

The Seasonality page helps you look at your current deals compared to the deals from the same time period in previous years and understand seasonal trends in your business. This can help give added context to your business performance as opposed to simply comparing the previous quarter.


Products

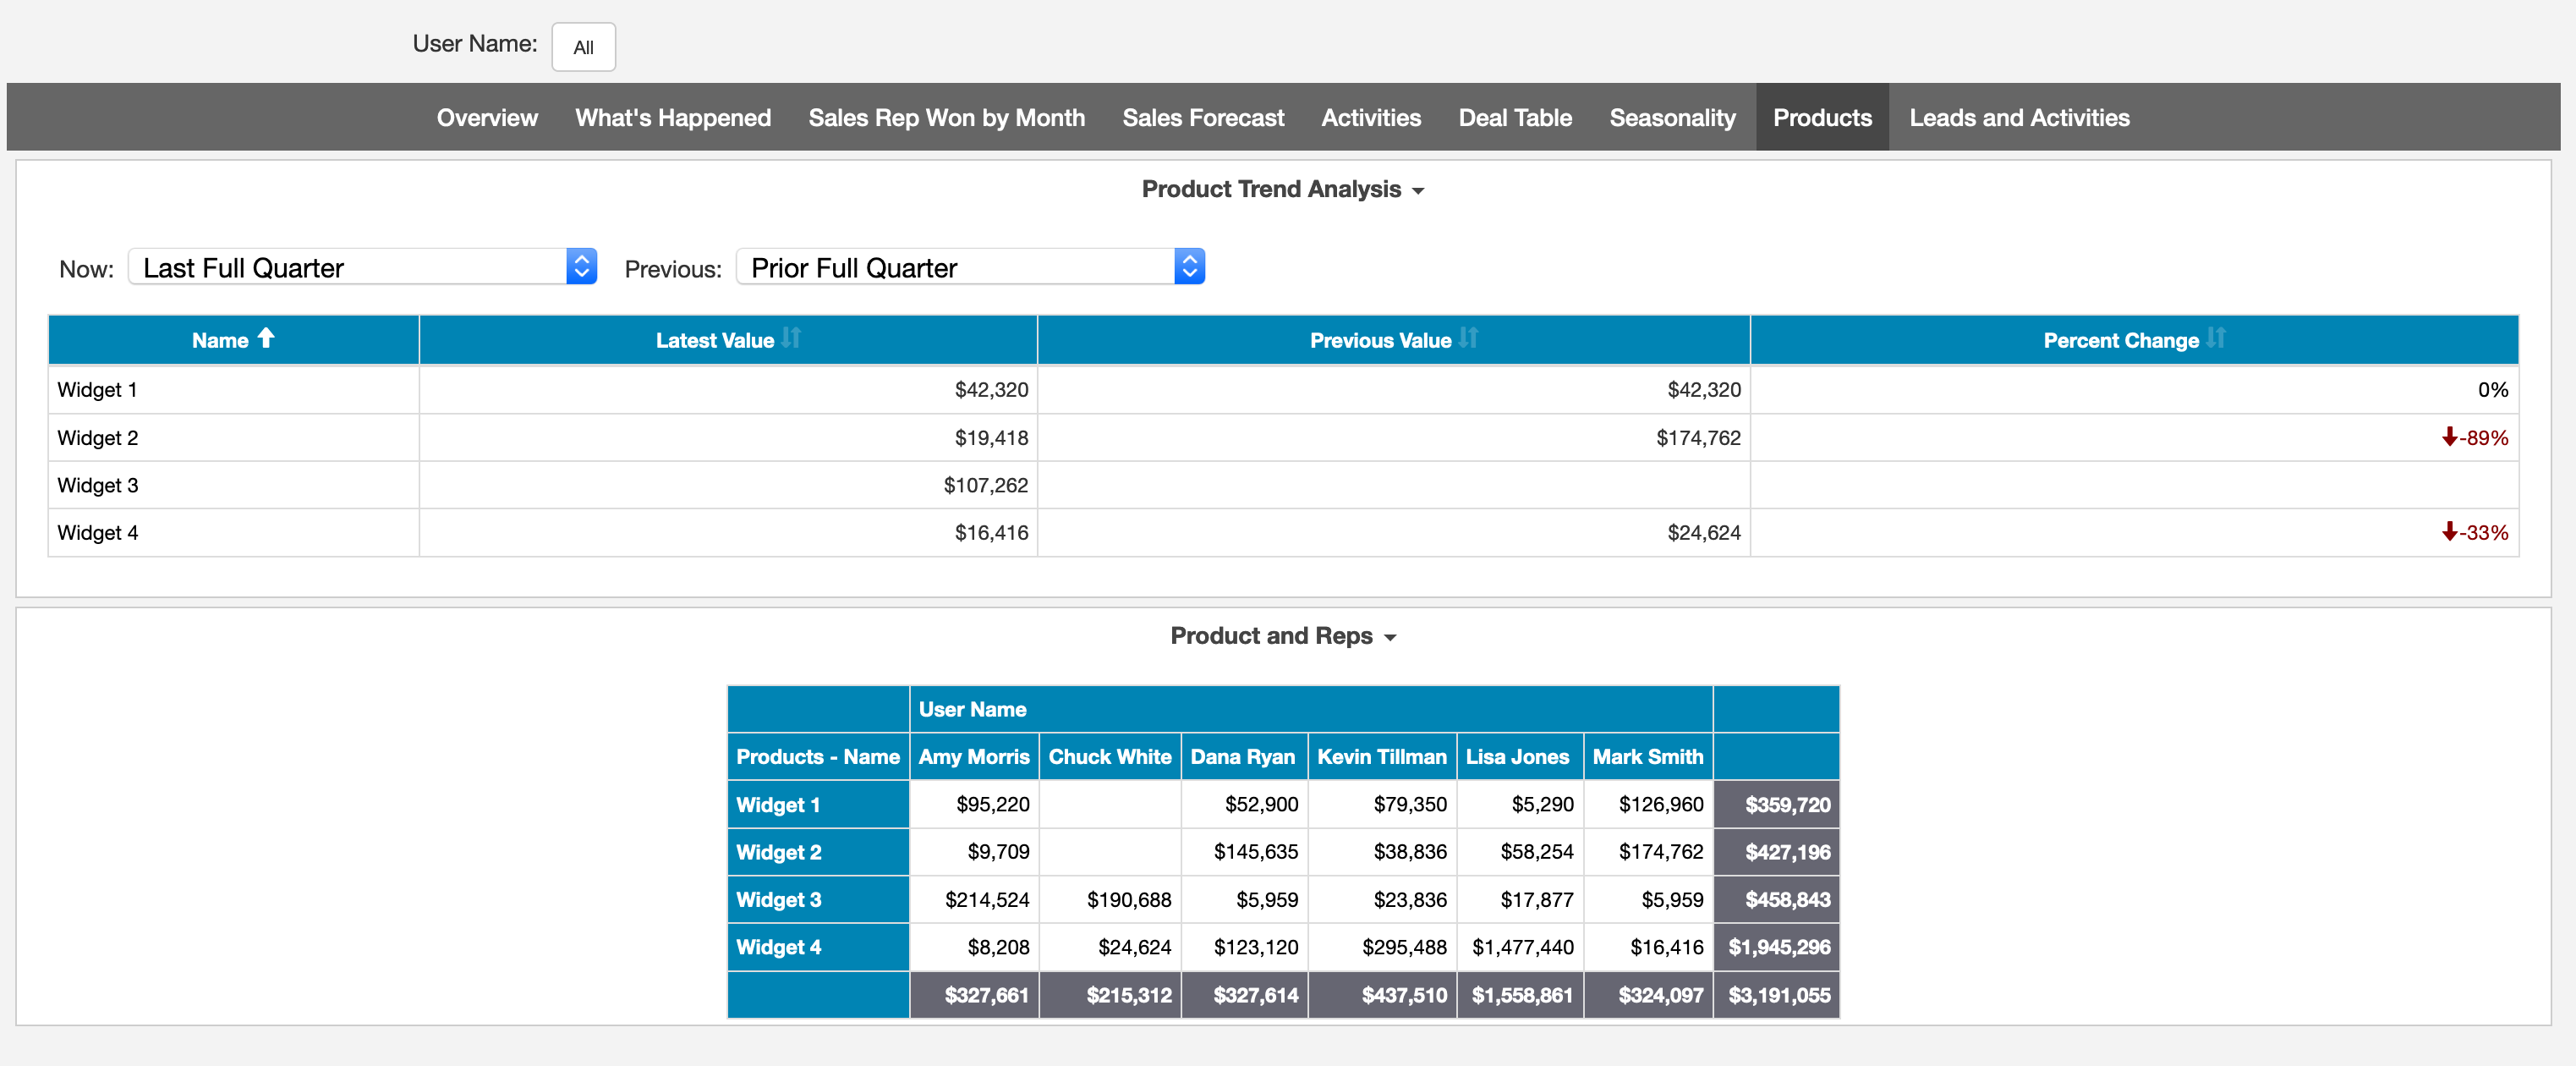
Teamwork CRM Dashboard Overview

The Products page gives you a trend analysis of sales by product and a breakdown of which reps are successfully selling a particular product.


Leads and Activities

Teamwork CRM Dashboard Overview

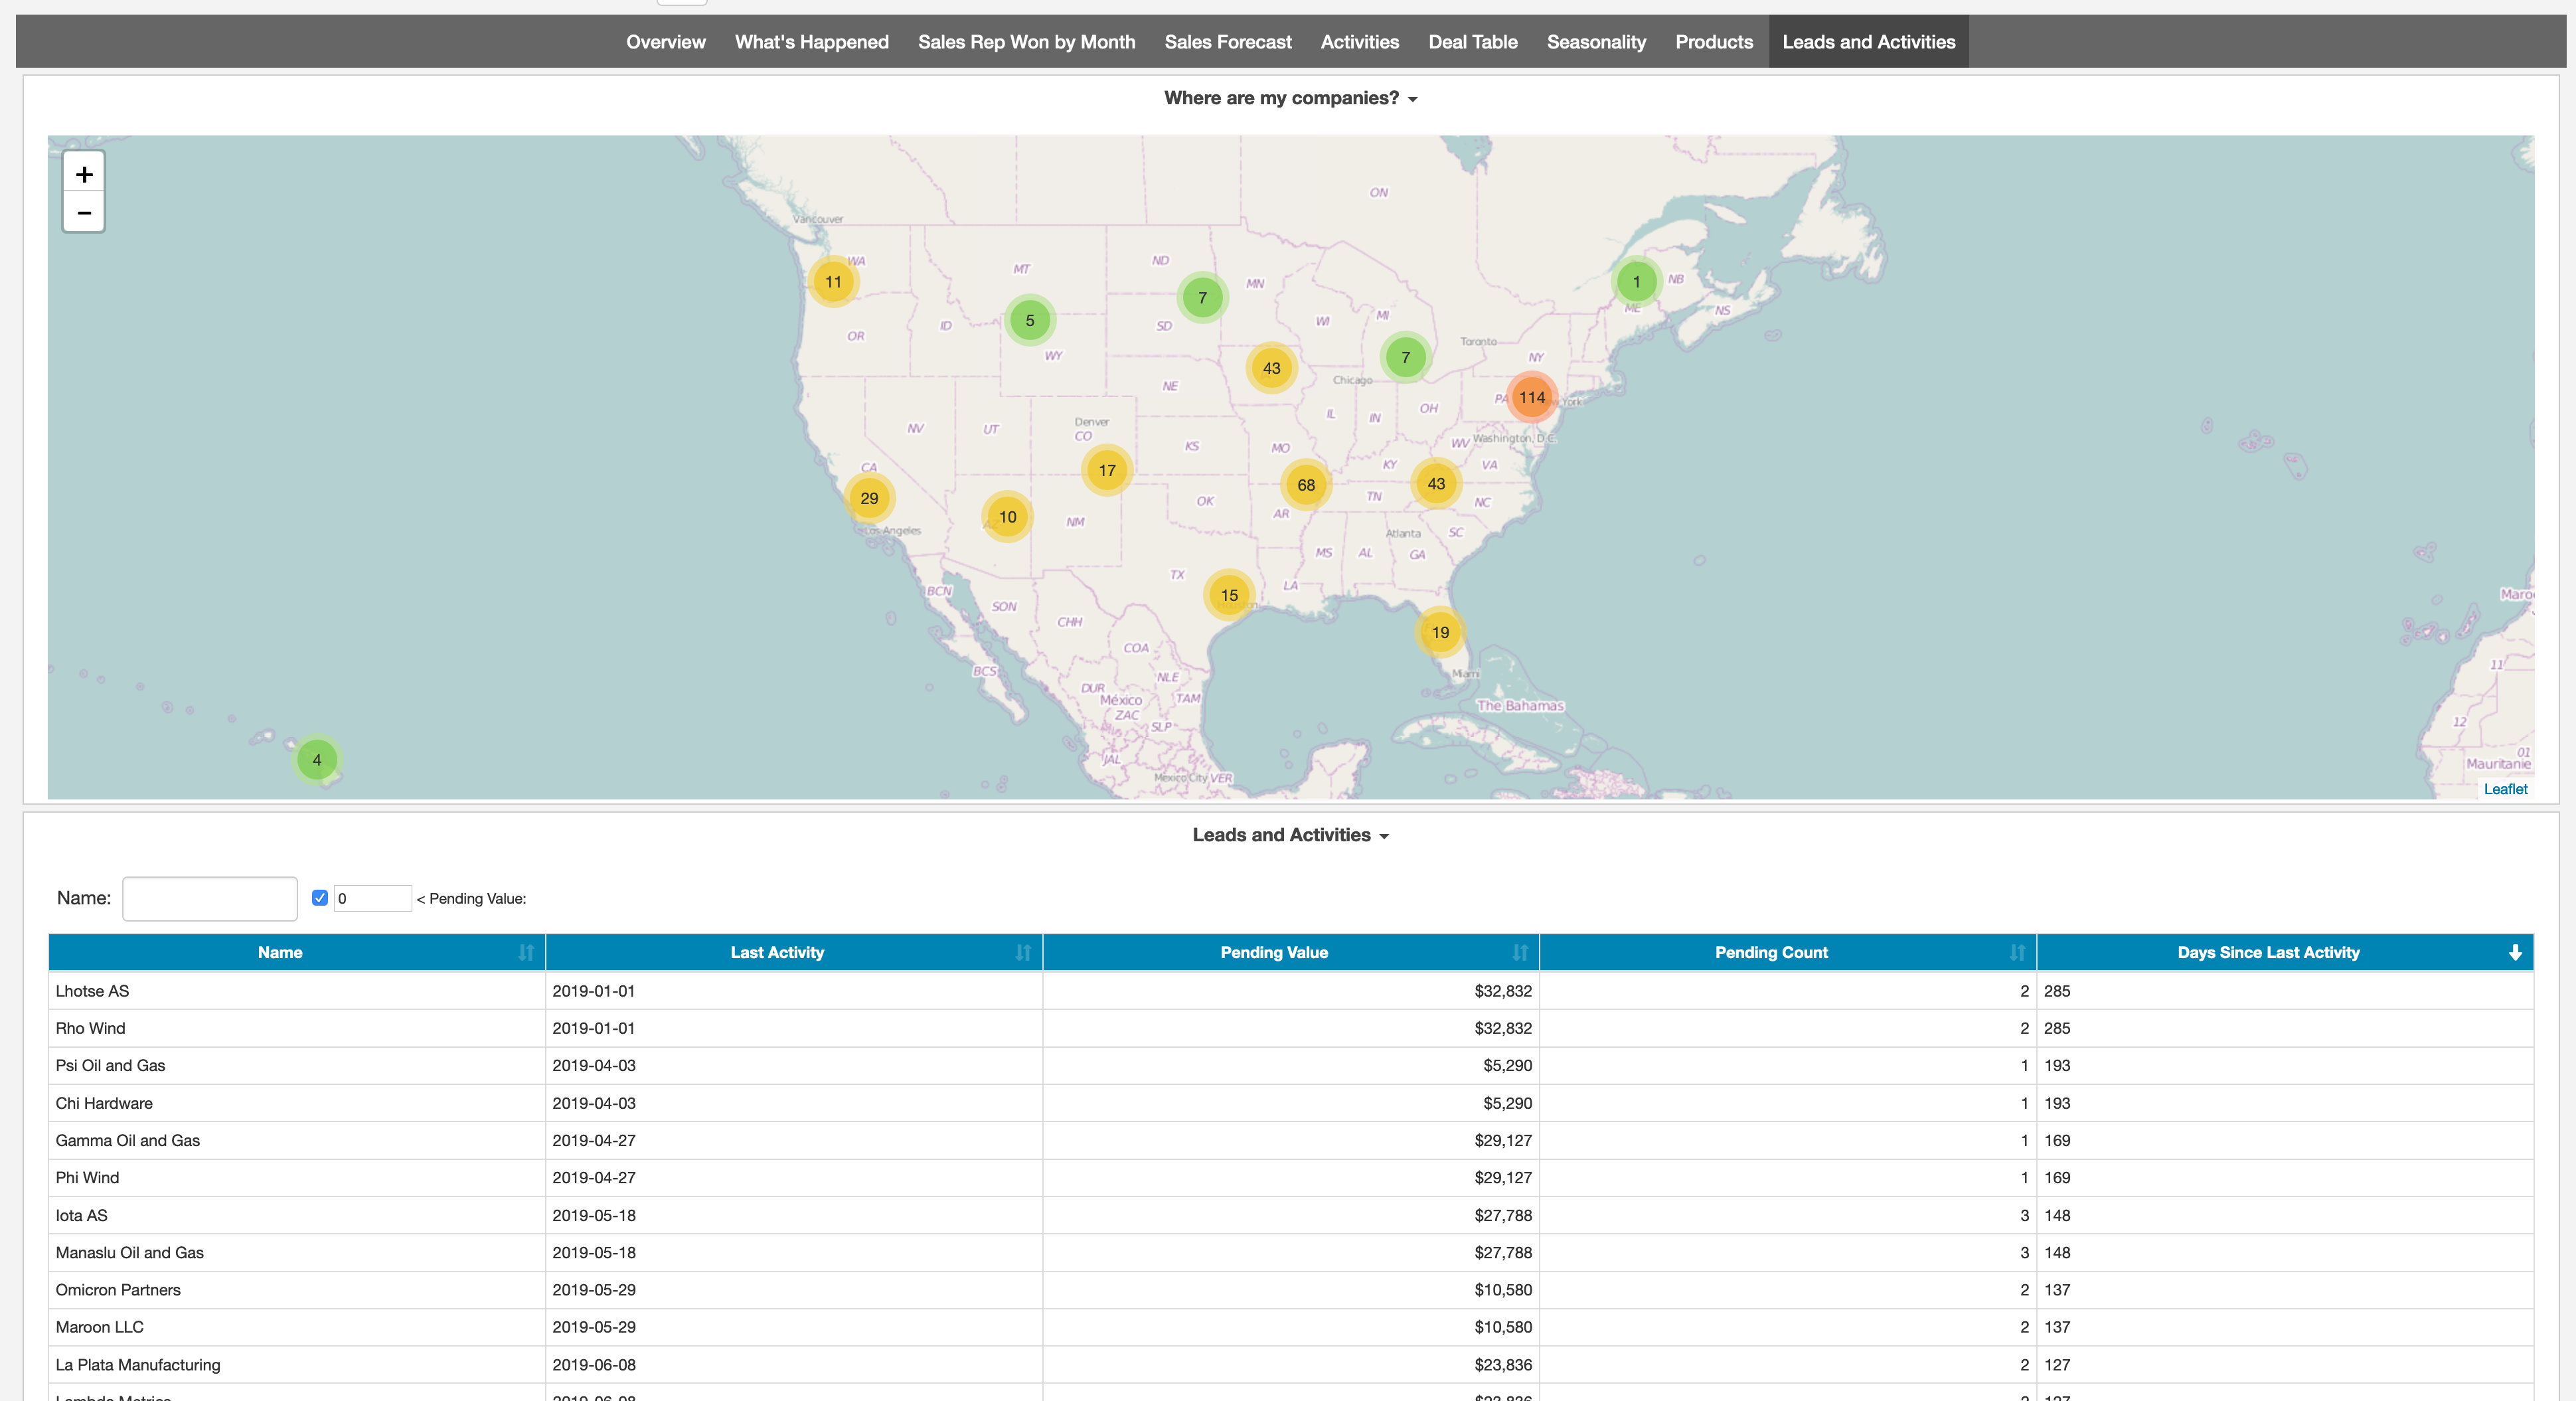
The Leads and Activities page gives you a visualization of where your leads are. You're also able to see which companies haven't had recent activity to help capture cold, stagnant leads before they go away altogether.


Teamwork CRM Fields

The number of activities.

People assigned to the activity.

When the activity was created.

The description for the activity.

The date at which the activity is due.

The internal ID for the activity in Teamwork CRM.

True if the activity has been completed, false if not.

The date for the activity.

The title for the activity.

The type of activity (email, call, etc).

The average number of days for a deal to close going from its creation time.

The average size of the deal in your currency.

When the deal was successfully won.

The number of companies.

When the company was created.

The internal ID of the company in Teamwork CRM.

The name of the company.

The postal code/ZIP code of the company.

The name of the contact.

The postal code/ZIP code of the contact.

The internal ID of the deal in Teamwork CRM.

The date at which the deal left the pipeline, either by winning or losing.

The URL of the deal in Teamwork CRM.

The number of deals.

When the deal was created.

Whether the deal is open, won, or lost.

The title of the deal.

The expected close date for the deal.

The number of lost deals.

The currency value of lost deals.

The number of the days that the deal has been open.

The number of open deals

The currency value of open deals.

The price of a product.

The quantity of a product for a particular deal.

The name of a product.

The stage of a deal.

The total currency value of a deal.

The user who owns a deal.

The number of won deals.

The currency value of won deals.